
监控 Centreon 检查服务的 SLA

根据情况,一些奇怪的事情可能会派上用场,可能是了解我们目前正在 Centreons 中监控的任何服务的 SLA. 它也可以针对我们在业务级别进行监控时进行设计, 了解您的可用性.
正如我们所知, Centreon 将其指标和状态存储在 MariaDB 数据库中, 我们可以简单地通过 MySQL 查询及时或在 % Centreon 中受监控服务的状态. 我们将能够知道多长时间 (或 percentage) 一直处于 OK 状态, 警告, 危急, 未知或正在维护中. 为什么? 井, 众所周知,我们可以知道 Centreon 中任何主机或服务的 SLA, 但是监控它以在它未实现时提醒我们是另一回事, 或者例如通过 NagVis 在我们的商业服务中查看它们.
不错, 首先,如果您不监控 MySQL 查询,那将会很有趣, 退房 这篇文章. 当您已经拥有允许您查询 MySQL 数据库的脚本时, 我们将能够创建我们需要的命令以及每个命令及其查询类型. 由于某些命令将帮助我们监控主机的 SLA, 其他服务, 其他人会在时间里给我们结果,其他人会在 %, 因此,根据您的需要,我在这里为您留下一些可能性:
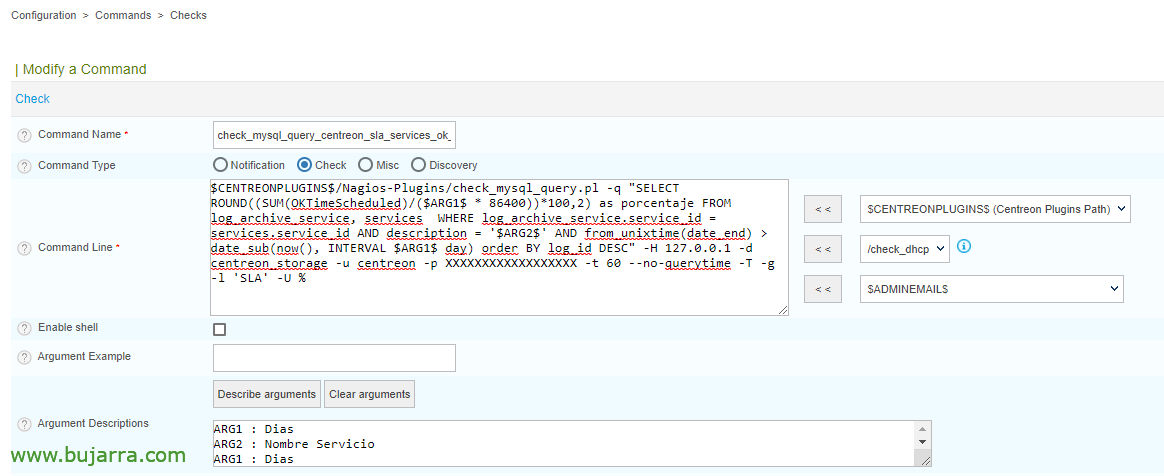
- OK Services 的 SLA %:
$CENTREONPLUGINS$/Nagios-插件/check_mysql_query.pl -q "选择圆角((和(OKTimeScheduled)/($ARG1$ * 86400))*100,2) 作为 log_archive_service 的百分比, 服务 WHERE log_archive_service.service_id = services.service_id AND description = '$ARG 2$' AND from_unixtime(date_end) > date_sub(现在(), 间隔 $ARG 1$ 天) 按 log_id DESC 订购" -H 127.0.0.1 -d centreon_storage -u centreon -p CONTRASEÑA_USUARIO_CENTREON -t 60 --no-querytime -T -g -l 'SLA' -U %
- SLA de Servicios OK en Tiempo:
$CENTREONPLUGINS$/Nagios-插件/check_mysql_query.pl -q "选择 CONCAT(地板(小时(sec_to_time(和(OKTimeScheduled))) / 24), “d_”, 国防部(小时(sec_to_time(和(OKTimeScheduled))), 24), “h_”, 分钟(sec_to_time(和(OKTimeScheduled))), 'm') AS Tiempo 来自 log_archive_service, 服务 WHERE log_archive_service.service_id = services.service_id AND description = '$ARG 2$' AND from_unixtime(date_end) > date_sub(现在(), 间隔 $ARG 1$ 天) 按 log_id DESC 订购" -H 127.0.0.1 -d centreon_storage -u centreon -p CONTRASEÑA_USUARIO_CENTREON -t 60 --no-querytime -T -g -l 'SLA'
- SLA de servicios warning en %:
$CENTREONPLUGINS$/Nagios-插件/check_mysql_query.pl -q "选择圆角((和(警告 TimeScheduled)/($ARG1$ * 86400))*100,2) 作为 log_archive_service 的百分比, 服务 WHERE log_archive_service.service_id = services.service_id AND description = '$ARG 2$' AND from_unixtime(date_end) > date_sub(现在(), 间隔 $ARG 1$ 天) 按 log_id DESC 订购" -H 127.0.0.1 -d centreon_storage -u centreon -p CONTRASEÑA_USUARIO_CENTREON -t 60 --no-querytime -T -g -l 'SLA' -U %
- SLA de Servicios Warning en Tiempo:
$CENTREONPLUGINS$/Nagios-插件/check_mysql_query.pl -q "选择 CONCAT(地板(小时(sec_to_time(和(警告 TimeScheduled))) / 24), “d_”, 国防部(小时(sec_to_time(和(警告 TimeScheduled))), 24), “h_”, 分钟(sec_to_time(和(警告 TimeScheduled))), 'm') AS Tiempo 来自 log_archive_service, 服务 WHERE log_archive_service.service_id = services.service_id AND description = '$ARG 2$' AND from_unixtime(date_end) > date_sub(现在(), 间隔 $ARG 1$ 天) 按 log_id DESC 订购" -H 127.0.0.1 -d centreon_storage -u centreon -p CONTRASEÑA_USUARIO_CENTREON -t 60 --no-querytime -T -g -l 'SLA'
- SLA de servicios Critical en %:
$CENTREONPLUGINS$/Nagios-插件/check_mysql_query.pl -q "选择圆角((和(CRITICALTimeScheduled)/($ARG1$ * 86400))*100,2) 作为 log_archive_service 的百分比, 服务 WHERE log_archive_service.service_id = services.service_id AND description = '$ARG 2$' AND from_unixtime(date_end) > date_sub(现在(), 间隔 $ARG 1$ 天) 按 log_id DESC 订购" -H 127.0.0.1 -d centreon_storage -u centreon -p CONTRASEÑA_USUARIO_CENTREON -t 60 --no-querytime -T -g -l 'SLA' -U %
- SLA de Servicios Critical en Tiempo:
$CENTREONPLUGINS$/Nagios-插件/check_mysql_query.pl -q "选择 CONCAT(地板(小时(sec_to_time(和(CRITICALTimeScheduled))) / 24), “d_”, 国防部(小时(sec_to_time(和(CRITICALTimeScheduled))), 24), “h_”, 分钟(sec_to_time(和(CRITICALTimeScheduled))), 'm') AS Tiempo 来自 log_archive_service, 服务 WHERE log_archive_service.service_id = services.service_id AND description = '$ARG 2$' AND from_unixtime(date_end) > date_sub(现在(), 间隔 $ARG 1$ 天) 按 log_id DESC 订购" -H 127.0.0.1 -d centreon_storage -u centreon -p CONTRASEÑA_USUARIO_CENTREON -t 60 --no-querytime -T -g -l 'SLA'
- SLA de Hosts Uptime en %:
$CENTREONPLUGINS$/Nagios-插件/check_mysql_query.pl -q "选择圆角((和(UPTimeScheduled 计划)/($ARG1$ * 86400))*100,2) 饰演 porcentaje FROM hosts, log_archive_host其中 log_archive_host.host_id = hosts.host_id 并且 hosts.name = '$ARG 2$' 并且 from_unixtime(date_end) > date_sub(现在(), 间隔 $ARG 1$ 天) 订购方式 date_end DESC" -H 127.0.0.1 -d centreon_storage -u centreon -p CONTRASEÑA_USUARIO_CENTREON -t 60 --no-querytime -T -g -l 'SLA' -U %
- SLA de Hosts Uptime en Tiempo:
$CENTREONPLUGINS$/Nagios-插件/check_mysql_query.pl -q "选择 CONCAT(地板(小时(sec_to_time(和(UPTimeScheduled 计划))) / 24), “d_”, 国防部(小时(sec_to_time(和(UPTimeScheduled 计划))), 24), “h_”, 分钟(sec_to_time(和(UPTimeScheduled 计划))), 'm') AS Tiempo FROM 主机, log_archive_host其中 log_archive_host.host_id = hosts.host_id 并且 hosts.name = '$ARG 2$' 并且 from_unixtime(date_end) > date_sub(现在(), 间隔 $ARG 1$ 天) 订购方式 date_end DESC" -H 127.0.0.1 -d centreon_storage -u centreon -p CONTRASEÑA_USUARIO_CENTREON -t 60 --no-querytime -T -g -l 'SLA'
- 主机停机时间 SLA %:
$CENTREONPLUGINS$/Nagios-插件/check_mysql_query.pl -q "选择圆角((和(DOWNTimeScheduled 计划)/($ARG1$ * 86400))*100,2) 饰演 porcentaje FROM hosts, log_archive_host其中 log_archive_host.host_id = hosts.host_id 并且 hosts.name = '$ARG 2$' 并且 from_unixtime(date_end) > date_sub(现在(), 间隔 $ARG 1$ 天) 订购方式 date_end DESC" -H 127.0.0.1 -d centreon_storage -u centreon -p CONTRASEÑA_USUARIO_CENTREON -t 60 --no-querytime -T -g -l 'SLA' -U %
- SLA de Hosts Downtime en Tiempo:
$CENTREONPLUGINS$/Nagios-插件/check_mysql_query.pl -q "选择 CONCAT(地板(小时(sec_to_time(和(DOWNTimeScheduled 计划))) / 24), “d_”, 国防部(小时(sec_to_time(和(DOWNTimeScheduled 计划))), 24), “h_”, 分钟(sec_to_time(和(DOWNTimeScheduled 计划))), 'm') AS Tiempo FROM 主机, log_archive_host其中 log_archive_host.host_id = hosts.host_id 并且 hosts.name = '$ARG 2$' 并且 from_unixtime(date_end) > date_sub(现在(), 间隔 $ARG 1$ 天) 订购方式 date_end DESC" -H 127.0.0.1 -d centreon_storage -u centreon -p CONTRASEÑA_USUARIO_CENTREON -t 60 --no-querytime -T -g -l 'SLA'
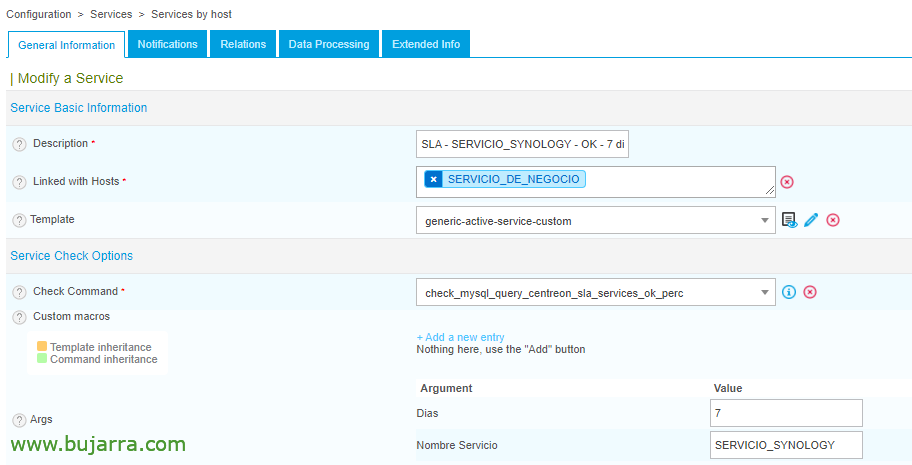
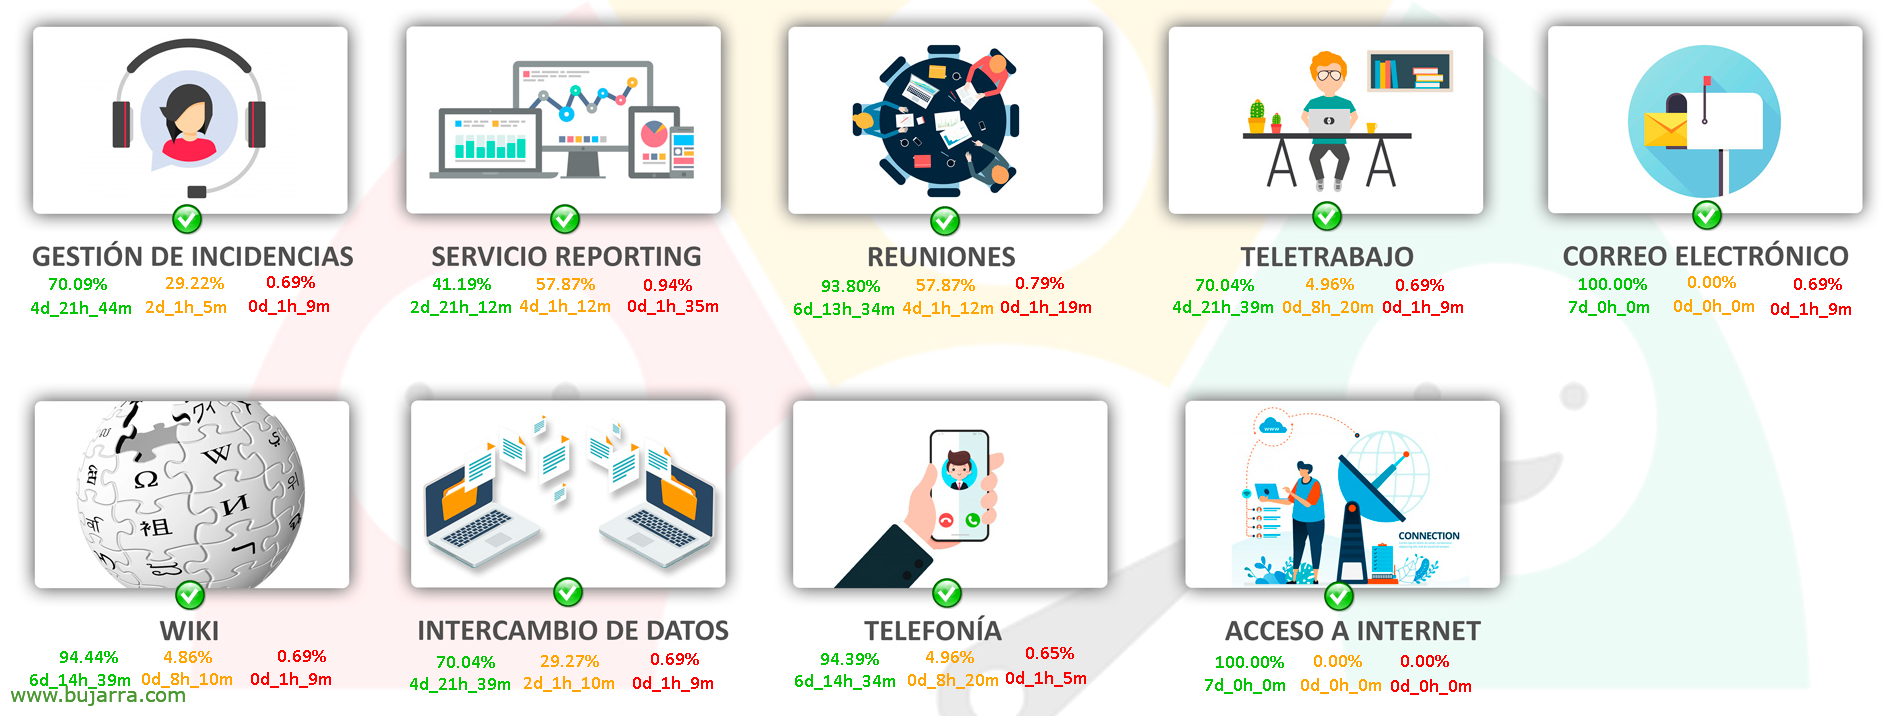
现在我们只需要创建我们感兴趣的尽可能多的服务来监控 SLA, 在本案例研究中, 我使用它们只是为了测量 商业服务, 因此在 NagVis 中查看它们. 作为论点,我们将把我们感兴趣的 SLA 的日期放在服务的名义下, 需要检查的 Service 的唯一名称.

一如既往, 录制和导出设置后, 我们将准备好我们的 SLA 服务,通过 Centreon 数据库中的查询来检查服务状态的时间或百分比.
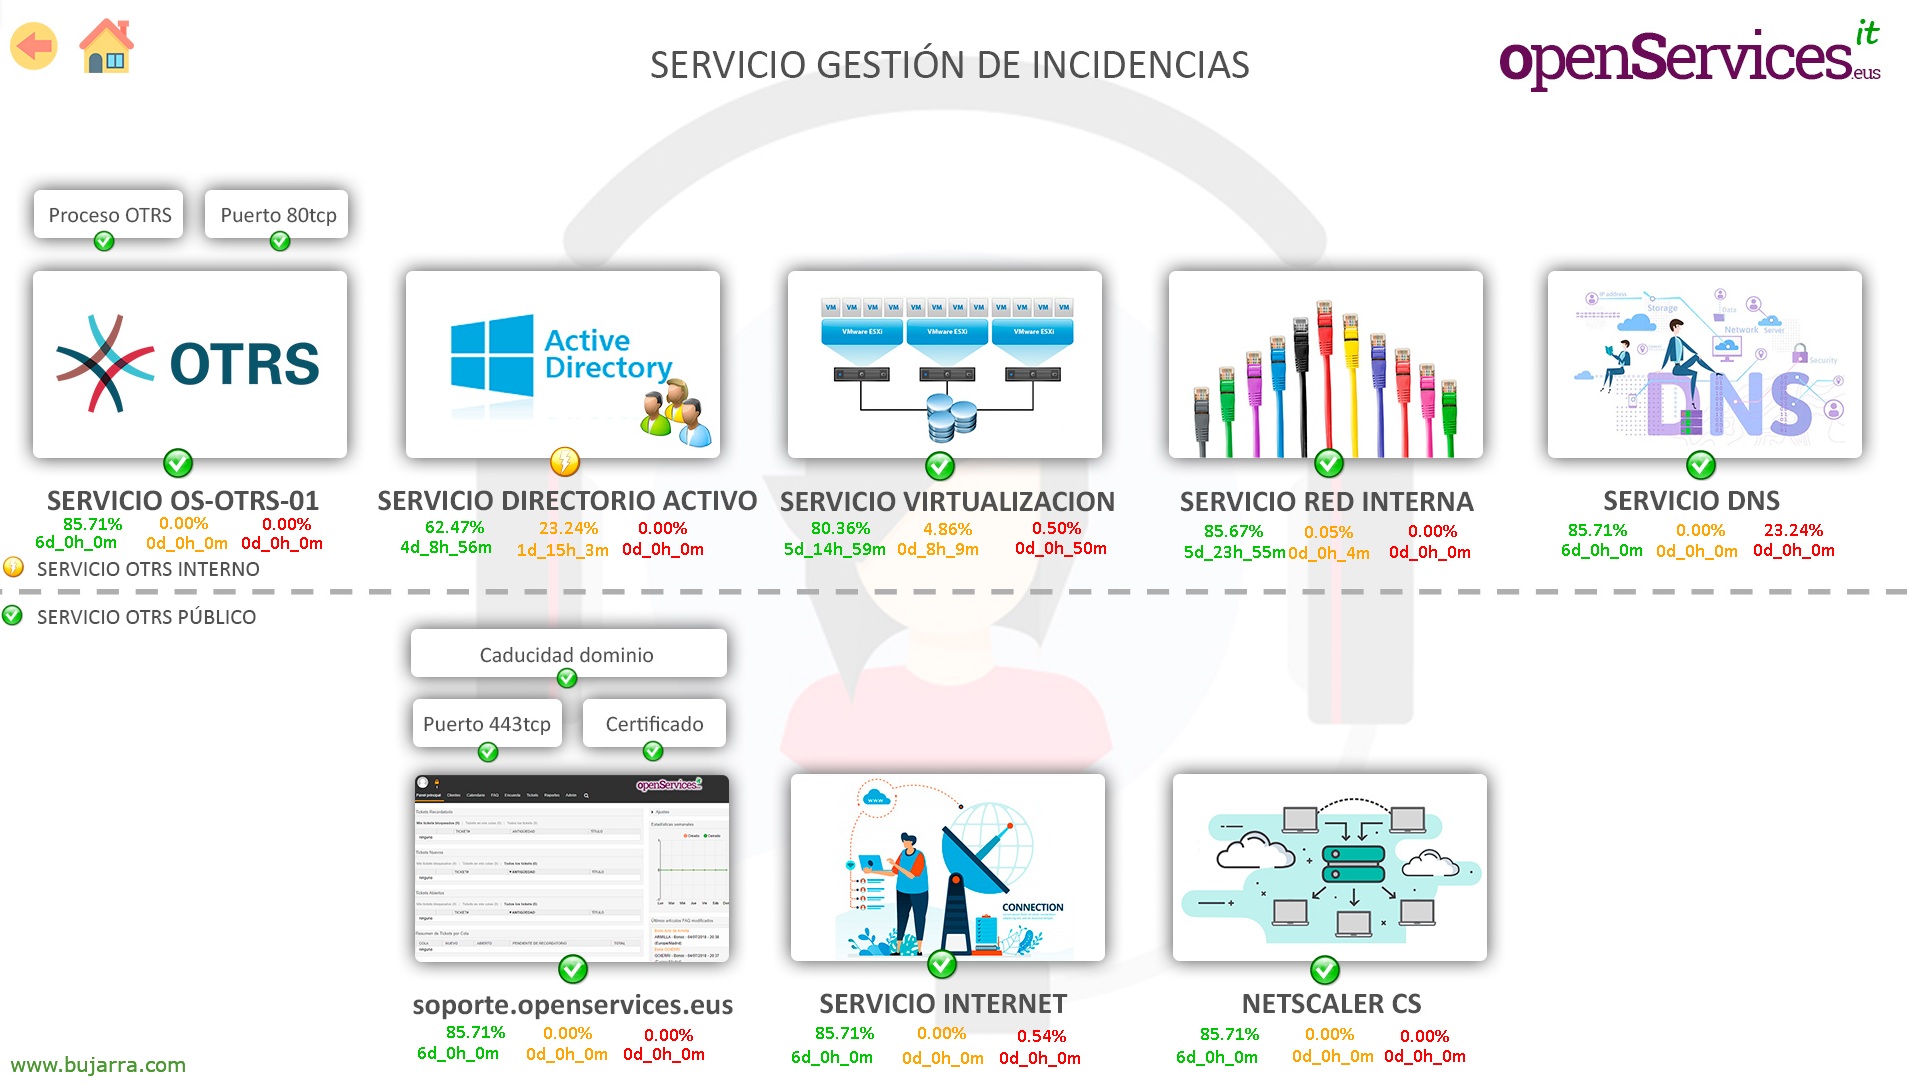
在 NagVis 中, 使用 RawNumbers Gadget,我们将能够添加受监控的 SLA 项目,并且在地图之间移动并了解任何服务提供的 SLA 时,它将更具吸引力, 非常适合非 100% 技术人员希望实时了解其基础设施的状态.