Nagios – Monitorando nossos hosts ESXi

Neste documento, veremos todos os passos necessários para podermos monitorizar um host ESXi, veremos os parâmetros mais comuns e os valores que poderemos obter para ter um ambiente controlado graças ao Nagios e Centreon! É incrível toda a informação que poderemos obter! Em outros documentos veremos outra informação que poderemos obter do vCenter e das suas VMs, Hoje é dia de hosts!

Instalação de requisitos,
Começaremos primeiro instalando todos los requisitos necessários para usar um dos scripts mais comuns que podemos usar. Em Nagios Exchange podremos obter casi cualquier script que necesitemos, y de ahí nos descargaremos posteriormente uno que suelo usar yo para monitorizar hosts ESXi 4.x, 5.x o 6.x. Mas antes tendremos que instalar en la máquina nagios el SDK de VMware assim como todo lo necessário antes.
Tras tener todos los requisitos instalados y probado que funciona el script para monitorizar servidores ESXi, podremos ya sair de consola y usar el interface de Centreon para criar los hosts ESXi, los servicios que monitorizaremos y los comandos necessários. Espero que se entienda bien, a seguir los pasos!
Instalando los requisitos:
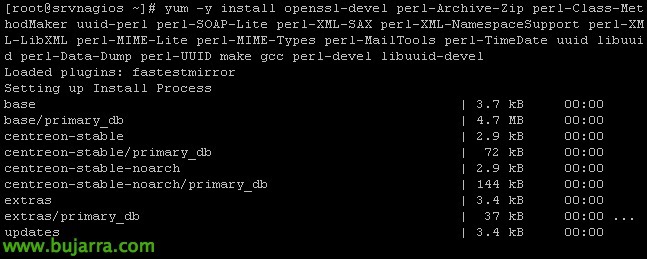
[Código-fonte]yum -y install openssl-devel perl-Archive-Zip perl-Class-MethodMaker uuid-perl perl-SOAP-Lite perl-XML-SAX perl-XML-NamespaceSupport perl-XML-LibXML perl-MIME-Lite perl-MIME-Types perl-MailTools perl-TimeDate uuid libuuid perl-Data-Dump perl-UUID make gcc perl-devel libuuid-devel cpan[/Código-fonte]
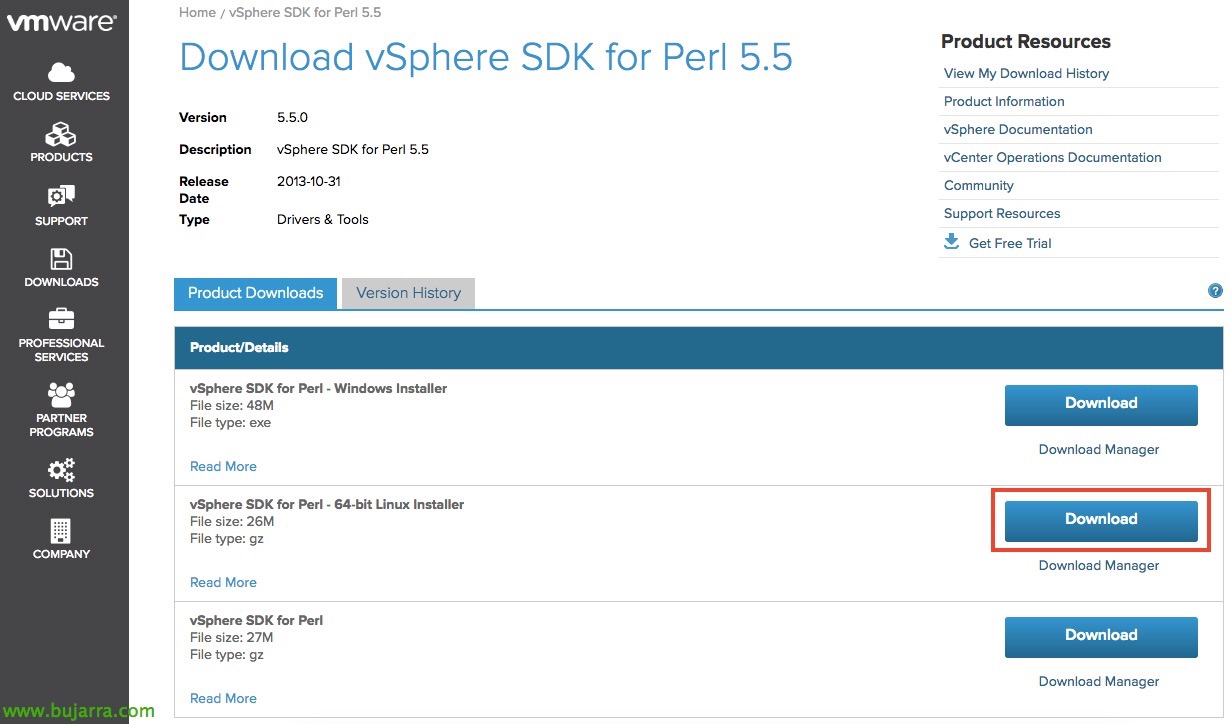
Procuramos no site de downloads da VMware, o vSphere SDK para Perl, baixamos o pacote gz de 64 bit.
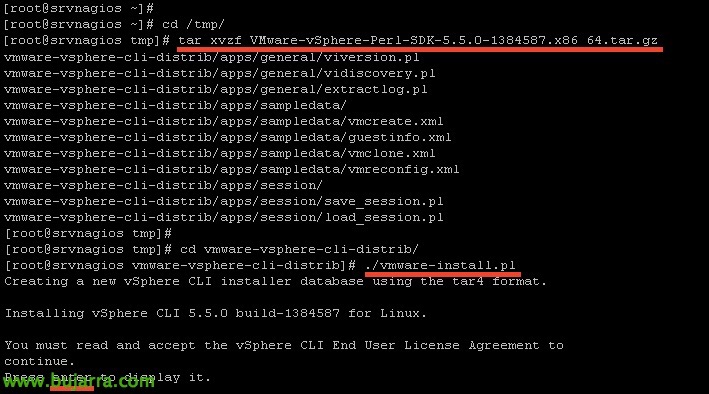
Carregamo-lo para o servidor Nagios através do WinSCP, por exemplo, e deixamo-lo no diretório temporário ‘/tmp/’. Descompactamo-lo e instalamo-lo:
[Código-fonte]tar xvzf VMware-vSphere-Perl-SDK-xxxxxxx.tar.gz
cd vmware-vsphere-cli-distrib/
./vmware-install.pl[/Código-fonte]
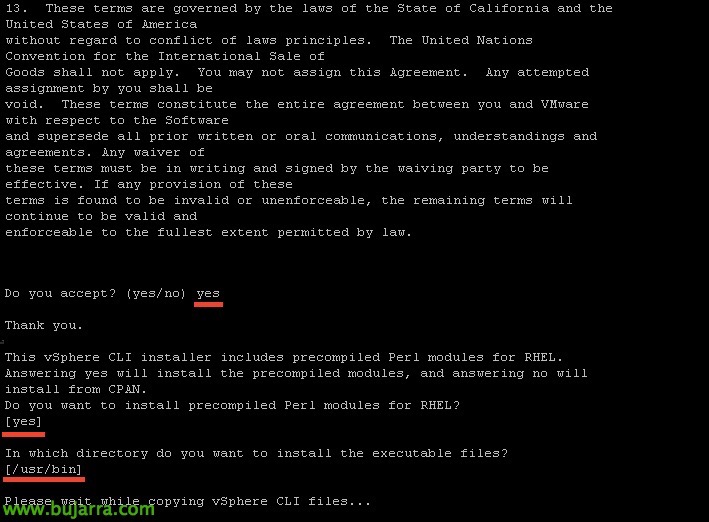
Instalamo-lo com os parâmetros padrão,
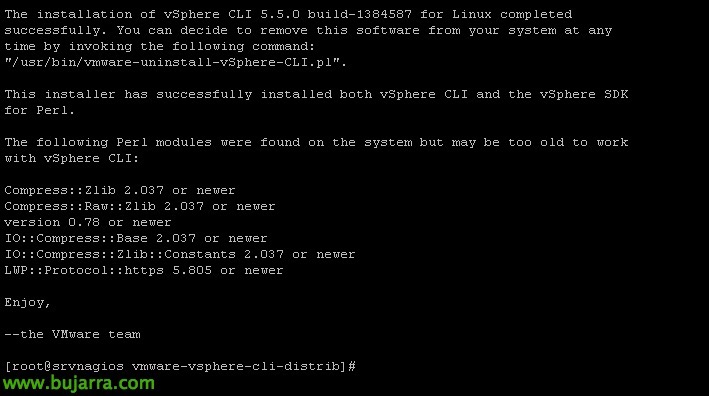
E após alguns segundos estará instalado,
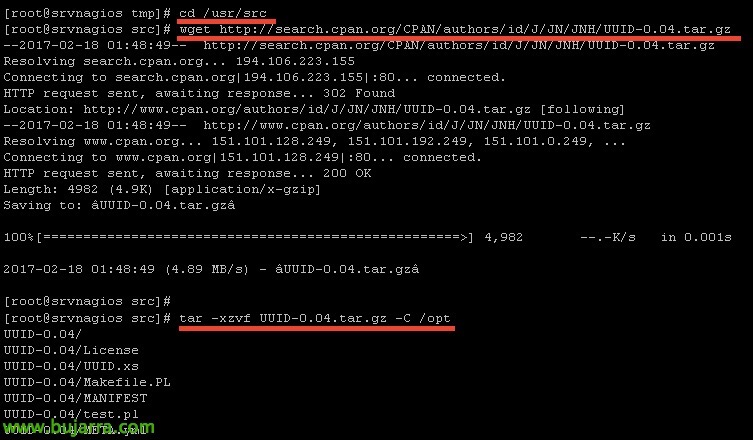
Instalamos o UUID:
[Código-fonte]cd /usr/src
WGET HTTP://search.cpan.org/CPAN/authors/id/J/JN/JNH/UUID-0.04.tar.gz
tar -xzvf UUID-0.04.tar.gz -C /opt[/Código-fonte]

Compilamo-lo:
[Código-fonte]cd /opt/UUID-0.04
perl Makefile.PL
Fazer[/Código-fonte]
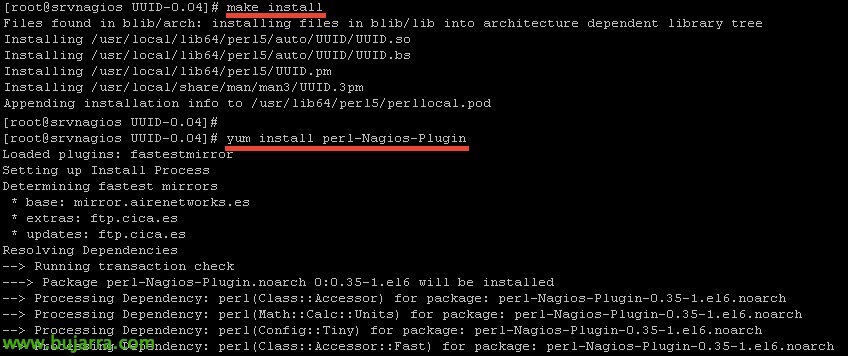
Y lo instalamos, así como ‘perl-Nagios-Plugin’ que también será necesario:
[Código-fonte]make install
yum install perl-Nagios-Plugin[/Código-fonte]
Instalamos más requisitos:
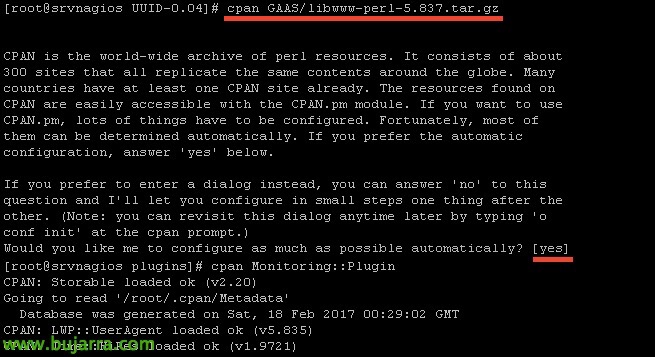
[Código-fonte]cpan GAAS/libwww-perl-5.837.tar.gz[/Código-fonte]

Y vamos acabando con este último!
[Código-fonte]cpan Monitoring::Plug-in[/Código-fonte]
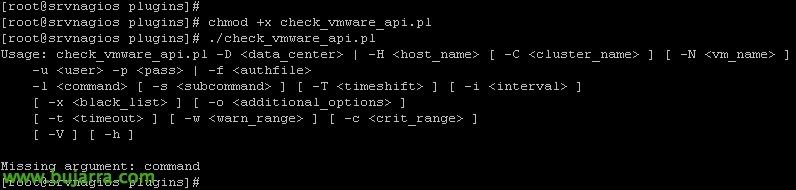
Finalmente, ya podremos bajar el script que nos permitirá obtener información de los hosts aquí https (em inglês)://exchange.nagios.org/directory/Plugins/Operating-Systems/%2A-Virtual-Environments/VMWare/check_vmware_api/details una vez descargado dejaremos el fichero ‘check_vmware_api.pl’ en '/usr/lib/centreon/plugins/’ y lo haremos ejecutable con ‘chmod +x check_vmware_api.pl’. Probaremos a ejecutarlo y si todo es correcto nos saldrá esta pantalla indicándonos las opciones que podremos usar.
Creando un usuario con privilegios en ESXi,
El script anterior, necesitará validarse contra el host ESXi para obtener la información que nos interese, por tanto crearemos un usuario en cada ESXi y daremos los permisos necesarios.

En cada ESXi, tras loguearnos bien con el cliente tradicional o el navegador web, iremos a la zona de “Usuários” y crearemos uno, le estableceremos también la contraseña.

No “Permisos”, añadiremos a este usuario a todo el ámbito posible, y le añadiremos con el rol de ‘Read-Only’.
Agora, crearemos en el directorio que nos interese (yo lo dejo en el mismo de plugins) un fichero, donde almacenaremos el usuario y contraseña que el comando usará para validarse cuando haga los checkeos. En este ejemplo lo guardo en ‘/usr/lib/centreon/plugins/check_vmware_api.auth’ con el siguiente formato:
[Código-fonte]username=usuario
password=Contraseña[/Código-fonte]

Y ya podremos executar cualquier checkeo contra un host ESXi, algo sencillo para probar, Utilização da CPU:
[Código-fonte]./check_vmware_api.pl -H SERVIDOR_ESXI -f check_vmware_api.auth -l cpu -s usage -w 80 -c 90[/Código-fonte]
Los parámetros que acompanham al comando vienen abajo descritos todos, en el comando anterior '-w’ será o % de aviso cuando sea Warning y '-c’ el valor de cuando sea Critico. Esto os lo comento por que es común en casi todos los comandos, y cada uno que use los varemos que quiera, en estes documentos encontraréis que normalmente quando alcance el 80% será algo Warning y cuando llegue al 90% será Critical.
Ahora ya sólo queda elegir los elementos que más nos interessa monitorizar, al final del documento os pondré todas las posibilidades que nos da este excelente comando 'check_vmware_api.pl'. Mas por agora apresento-vos os exemplos mais comuns para monitorizar informação de um host ESXi:
Uso de Memória RAM:
[Código-fonte]./check_vmware_api.pl -H SERVIDOR_ESXI -f check_vmware_api.auth -l mem -s usage -w 80 -c 90[/Código-fonte]
Uso de Memória Swap
[Código-fonte]./check_vmware_api.pl -H SERVIDOR_ESXI -f check_vmware_api.auth -l mem -s swap -w 1 -c 10[/Código-fonte]
Uso de Memória Balloning
[Código-fonte]./check_vmware_api.pl -H SERVIDOR_ESXI -f check_vmware_api.auth -l mem -s memctl -w 1 -c 10[/Código-fonte]
Uso de rede
[Código-fonte]./check_vmware_api.pl -H SERVIDOR_ESXI -f check_vmware_api.auth -l net -s usage -w 10240 -c 102400[/Código-fonte]
Detetar se temos alguma NIC caída,
[Código-fonte]./check_vmware_api.pl -H SERVIDOR_ESXI -f check_vmware_api.auth -l net -s nic -w 1 -c 2[/Código-fonte]
Monitorizar os datastores VMFS, em este, o comando devolve o uso livre, pelo que indicaremos com o seguinte formato em Warning e Critical o % de espaço livre,
[Código-fonte]./check_vmware_api.pl -H SERVIDOR_ESXI -f check_vmware_api.auth -l vmfs -s LUN04 -w 10%: -c 5%:[/Código-fonte]
Por ejemplo con el parámetro ‘runtime’ veremos un resumen general del servidor, y opcionalmente podremos añadirle otras opciones como ‘health’ para ver la salud, ‘temperature’ para ver los sensores de temperatura, o ‘status’ para ver un resumen entre otros.
[Código-fonte]./check_vmware_api.pl -H SERVIDOR_ESXI -f check_vmware_api.auth -l runtime
./check_vmware_api.pl -H SERVIDOR_ESXI -f check_vmware_api.auth -l runtime -s health
./check_vmware_api.pl -H SERVIDOR_ESXI -f check_vmware_api.auth -l runtime -s temperature
./check_vmware_api.pl -H SERVIDOR_ESXI -f check_vmware_api.auth -l runtime -s status[/Código-fonte]
Si usamos el parámetro ‘service’ podremos ver el status de todos los servicios de ESXi si están corriendo o no, e adicionalmente poderemos adicionar o nome dos serviços que nos interesse monitorizar apenas.
[Código-fonte]./check_vmware_api.pl -H SERVIDOR_ESXI -f check_vmware_api.auth -l service
./check_vmware_api.pl -H SERVIDOR_ESXI -f check_vmware_api.auth -l service -s DCUI vpxa[/Código-fonte]
Por enquanto com isto acho que nos basta, Não? Já que o script ‘check_vmware_api.pl’ tem ainda muitas mais coisas que poderás explorar e veremos noutros posts, também nos serviria para monitorizar Clusters de hosts, Data Centers, Máquinas Virtuales, etc… outro día ;), agora continuamos com os hosts!
Criando um host,
Aqui vamos finalmente dar de alta no Nagios o nosso primeiro servidor, um host ESXi! Vamos usar Centreon para facilitar todo o trabalho.
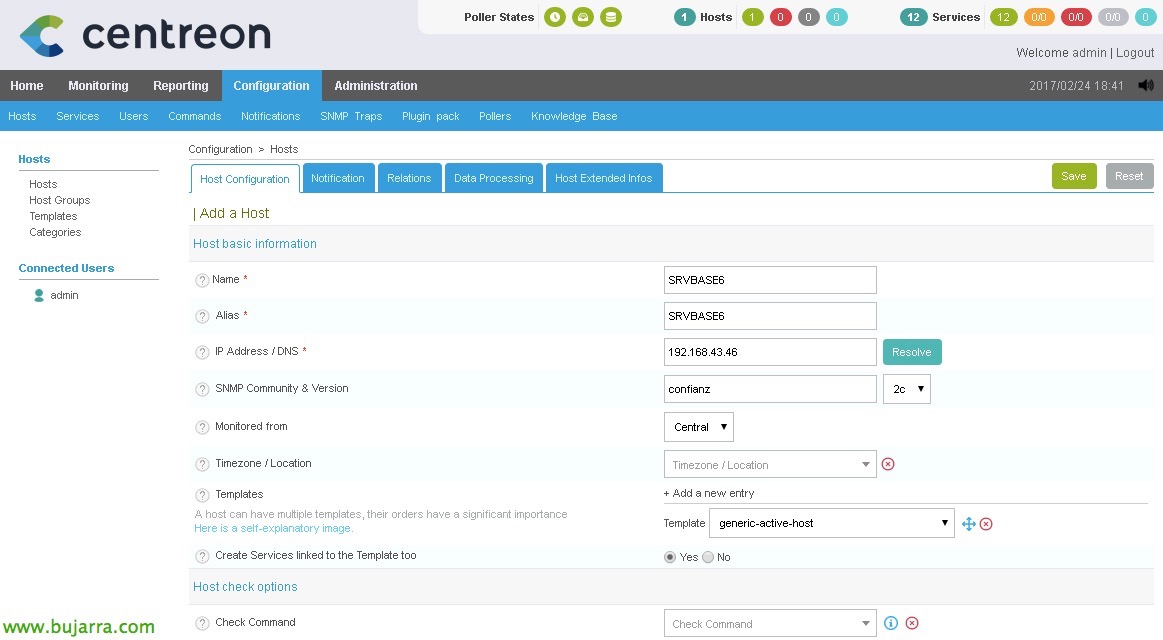
Desde “Configuração” > “Hosts” > “Adicionar”, adicionaremos o nosso primeiro servidor, completaremos pelo menos os seguintes campos:
- Nome: Nome do servidor.
- Alias: Apelido do servidor.
- Endereço IP / DNS: O endereço IP ou nome DNS do servidor.
- SNMP Community & Version: Neste caso não seria necessário.
- Monitorizado de: O poller que irá monitorizar este host.
- Modelo: Selecionamos 'generic-active-host'.
Criando um Comando,
Definiremos um Comando no Centreon usando variáveis para poder executar os comandos que vimos antes, este comando depois será chamado a partir de cada Serviço que criarmos para monitorizar a CPU, CARNEIRO… Nada melhor do que ver para entender 🙂

Gosto de chamar o Comando pelo mesmo nome que o script, por isso, neste caso criarei o comando 'check_vmware_api.pl'. Para fazer isso,, desde “Configuração” > “Comandos” > “Verifica” > “Adicionar”. Indicamos que é um comando do tipo 'Check'’ e na 'Command line' indicamos:
[Código-fonte]$CENTREONPLUGINS$/check_vmware_api.pl -H $HOSTADDRESS$ -f $CENTREONPLUGINS$/check_vmware_api.auth -l $ARG1$ -s $ARG2$ -w $ARG3$ -c $ARG4$[/Código-fonte]
- La variable $CENTREONPLUGINS$ es '/usr/lib/centreon/plugins/’
- La variable $HOSTADDRESS$ sería la dirección IP o nombre FQDN del servidor a monitorizar.
- ARG1 sería el primer argumento que le pasaremos, si recordamos es el 'Comando’ que se indica tras '-l'.
- ARG2 sería el primer argumento que le pasaremos,si recordamos es el 'SubComando’ que se indica tras '-s'.
- ARG3 será el valor de Warning.
- ARG4 será el valor de Critical.
Clique em “Descrever argumentos” para no tener que memorizar y saber esto.

Así que associamos de una forma sencilla que es cada Argumento, que depois quando creemos los servicios, lo agradeceremos. “Salvar”.
Creando los servicios,
Here ya por fín podremos criar los servicios de lo que queremos monitorizar, sea CPU, CARNEIRO, NICs caidas, estado de los datastores… por isso, nos apoyaremos como hemos dicho en el comando que acabamos de crear! Mirar qué fácil:

Em “Configuração” > “Serviços” > “Adicionar”, crearemos nuestro primer servicio! Rellenaremos al menos los siguientes datos:
- Descrição: Nombre del servicio, en mi caso CPU, CARNEIRO, Trocar memória…
- Vinculado a anfitriões: Aquí añadiremos el host que hemos creado antes, nuestro servidor ESXi.
- Modelo: Seleccionamos ‘generic-active-service’.
- Comando Check: Escogemos el comando que hemos creado antes también, que en mi caso le llame como el script ‘check_vmware_api.pl’
- Argumentos: Deberemos rellenar todos los argumentos que nos pida el comando.
- Uso de CPU: cpu / uso / 80 / 90
- CARNEIRO: mem / uso / 80 / 90
- Trocar memória: mem / swap / 1 / 10
- Memoria Balloning: mem / memctl / 1/ 10
- Estado de NIC: Rede / nic / 1 / 2
- …
Gravamos com “Salvar”,
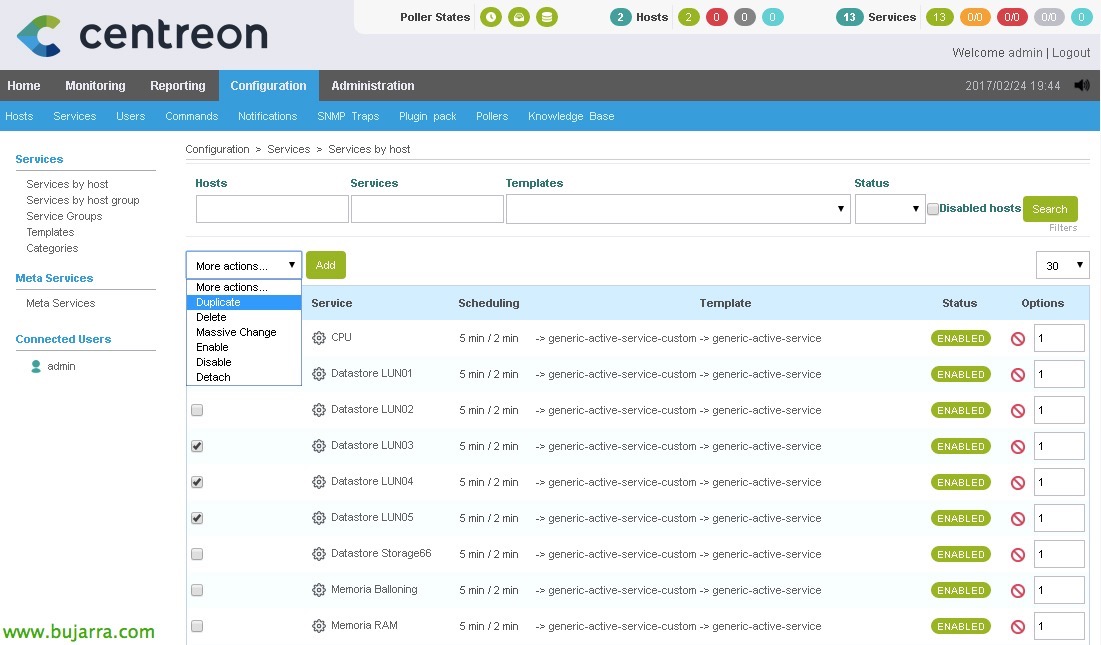
Para ir creando el resto de servicios, en vez de crearlos todos desde cero, lo más cómodo será duplicarlos, así sólo tendremos que editar los argumentos y será mucho más fácil crear los servicios.
Una vez que hayamos creado todos los servicios asociados a un host ESXi, si queremos ahora duplicar el trabajo realizado para monitorizar otro host ESXi que tengamos, o todos los que tengamos, pues desde “Configuração” > “Hosts”, seleccionaremos el ESXi que tenemos y lo duplicamos, con eso generamos un nuevo host, al que tendremos que cambiar el Nombre, Alias y Direccion IP y ya tendremos otro host listo con los mismos servicios!
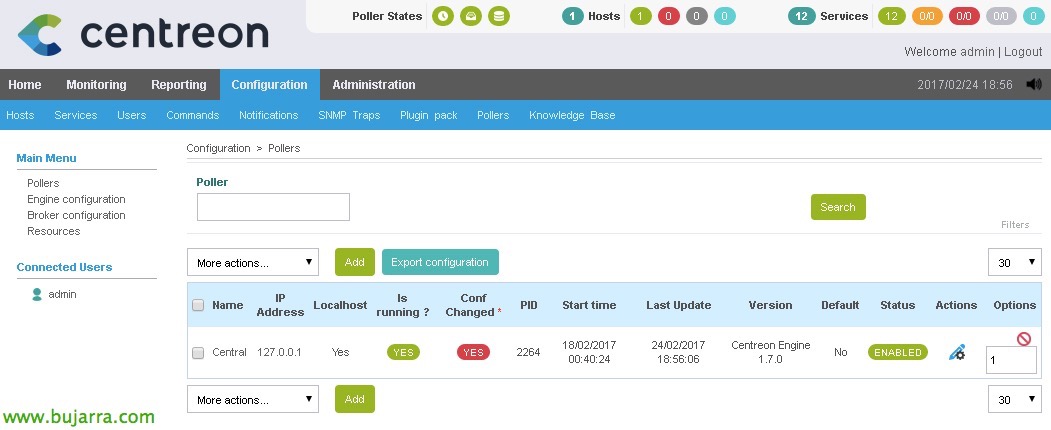
E nada, o de sempre, una vez finalizado el trabajo, guardamos los cambios, Cenreon generará los ficheros de nagios necesarios, “Configuração” > “Pesquisadores” > “Configuração de exportação”,
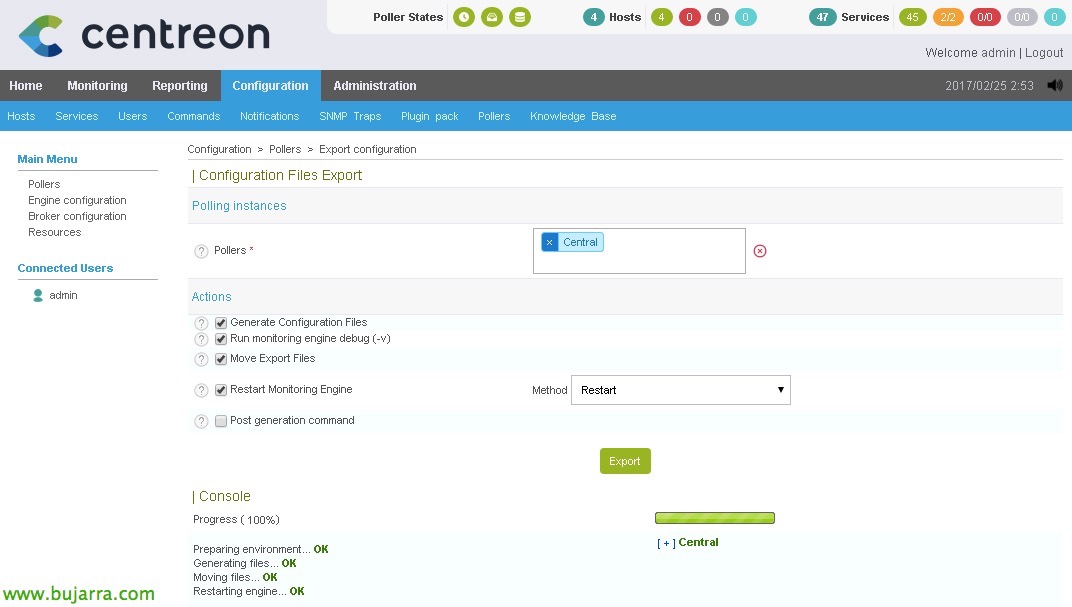
Seleccionamos nuestro poller, Marcamos as verificações e reiniciamos & “Exportação”,
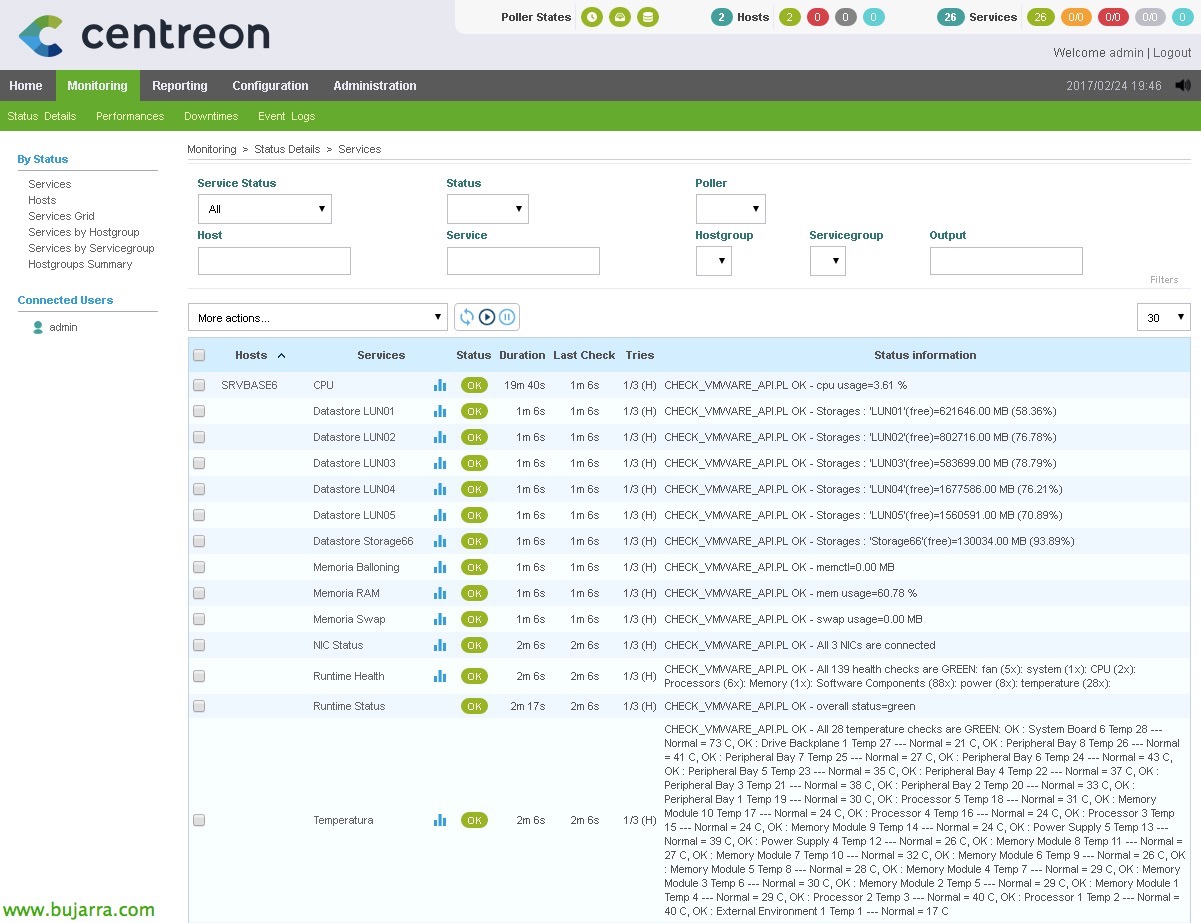
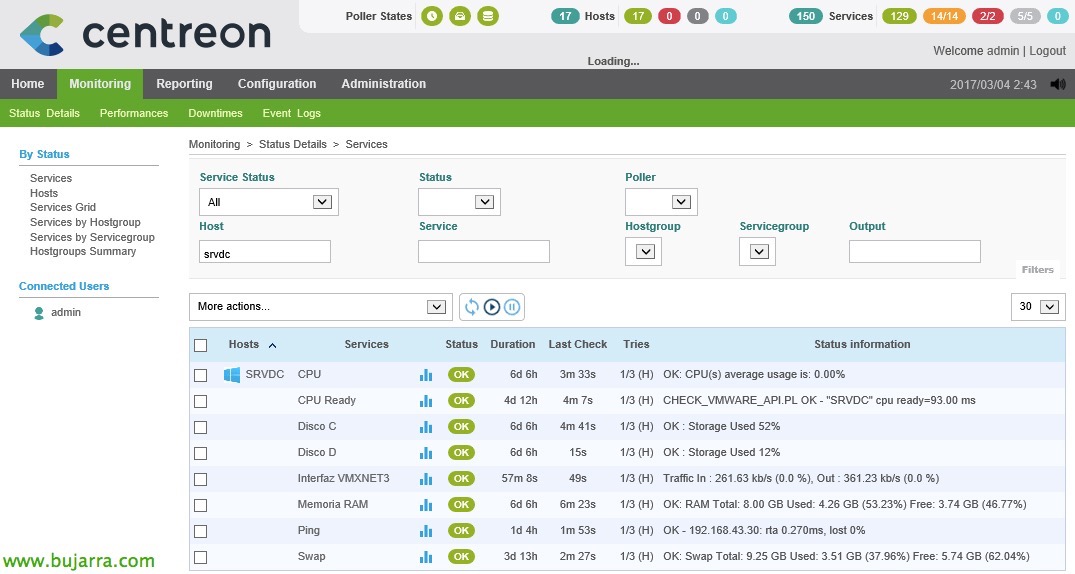
Uma vez que tudo é gerado, ya podremos ir a la parte de monitorización y comprobar que todo lo que hemos hecho funciona! Veremos todos os novos serviços que criámos que monitorizam coisas diferentes. Se quisermos forçar a verificação, Nós já sabemos, seleccionamos los servicios que nos interesen y en el combo seleccionamos ‘Services – Agendar verificação imediata (Forçado)’.
Y aquí os dejo todas las posibilidades del comando:
[Código-fonte]Uso: check_vmware_api.pl -D <data_center> | -H <host_name> [ -C <cluster_name> ] [ -N <vm_name> ]
-quer <utilizador> -p <Passe> | -f <authfile>
-l <comando> [ -s <subcommand> ] [ -T <timeshift> ] [ -eu <intervalo> ]
[ -x <black_list> ] [ -ou <additional_options> ]
[ -t <Timeout> ] [ -w <warn_range> ] [ -c <crit_range> ]
[ -V ] [ -h ]
-?, –uso
Print usage information
-h, –Ajuda
Print detailed help screen
-V, –Versão
Print version information
–extra-opts=[secção][@file]
Read options from an ini file.
for usage and examples.
-H, –host=<hostname>
ESX or ESXi hostname.
-C, –cluster=<clustername>
ESX or ESXi clustername.
-D, –datacenter=<DCname>
Datacenter hostname.
-N, –name=<vmname>
Virtual machine name.
-quer, –username=<nome de usuário>
Username to connect with.
-p, –password=<senha>
Password to use with the username.
-f, –authfile=<Caminho>
Authentication file with login and password. File syntax :
username=<login>
password=<senha>
-w, –warning=THRESHOLD
Warning threshold. See
for the threshold format. Por defeito, no threshold is set.
-c, –critical=THRESHOLD
Critical threshold. See
for the threshold format. Por defeito, no threshold is set.
-l, –command=COMMAND
Specify command type (CPU, MEM, NET, IO, VMFS, RUNTIME, …)
-s, –subcommand=SUBCOMMAND
Specify subcommand
-S, –sessionfile=SESSIONFILE
Specify a filename to store sessions for faster authentication
-x, –exclude=<black_list>
Specify black list
-ou, –options=<additional_options>
Specify additional command options (quickstats, …)
-T, –timestamp=<timeshift>
Timeshift in seconds that could fix issues with "Unknown error". Usar valores como 5, 10, 20, etc
-eu, –interval=<período de amostragem>
Período de amostragem em segundos. Intervalos históricos básicos: 300, 1800, 7200 ou 86400. Consulte a configuração para quaisquer alterações.
Suporta valores de intervalo para negociar automaticamente o valor do intervalo: r – intervalo em tempo real, h<número> – intervalo histórico especificado por posição.
O valor por omissão é 20 (tempo real). Como o cluster não tem intervalo de estatísticas em tempo real além de 20(tempo real por omissão) é obrigatório.
-M, –maxsamples=<contagem máxima de amostras>
Número máximo de amostras a recuperar. O número máximo de amostras é ignorado para intervalos históricos.
O valor por omissão é 1 (última amostra disponível).
–trace=<nível>
Definir nível de verbosidade do rastreio de pedidos/respostas da API vSphere
–generate_test=<ficheiro>
Gerar um script de caso de teste a partir do comando/subcomando executado e escrevê-lo em <ficheiro>. Se <ficheiro> is "stdout", o script do caso de teste é escrito em stdout em vez disso.
-t, –timeout=INTEGER
Seconds before plugin times out (inadimplência: 30)
-v, –verbose
Show details for command-line debugging (can repeat up to 3 times)
Supported commands(^ – blank or not specified parameter, ou – Opções, T – timeshift value, b – Lista negra) :
VM specific :
* cpu – shows cpu info
+ uso – CPU usage in percentage
+ usagemhz – CPU usage in MHz
+ esperar – CPU wait time in ms
+ ready – CPU ready time in ms
^ all cpu info(no thresholds)
* mem – shows mem info
+ uso – mem usage in percentage
+ usagemb – mem usage in MB
+ swap – swap mem usage in MB
+ swapin – swapin mem usage in MB
+ swapout – swapout mem usage in MB
+ overhead – additional mem used by VM Server in MB
+ overall – overall mem used by VM Server in MB
+ ativa – active mem usage in MB
+ memctl – mem used by VM memory control driver(vmmemctl) that controls ballooning
^ all mem info(except overall and no thresholds)
* Rede – shows net info
+ uso – utilização global da rede em KBps(Kilobytes por Segundo)
+ receber – receber em KBps(Kilobytes por Segundo)
+ enviar – enviar em KBps(Kilobytes por Segundo)
^ toda a informação da rede(exceto uso e sem limiares)
* io – mostra informação de I/O do disco
+ uso – utilização total do disco em MB/s
+ read – leitura do uso do disco em MB/s
+ escrever – escrever utilização do disco em MB/s
^ all disk io info(no thresholds)
* Runtime – mostrar informação em tempo de execução
+ com – estado da ligação
+ cpu – CPU alocada em MHz
+ mem – memória alocada na placa de base
+ estado – estado da máquina virtual (PARA CIMA, BAIXA, SUSPENSA)
+ estado – estado geral do objeto (cinzento/verde/vermelho/amarelo)
+ conexões de consola – ligações de consola para VM
+ convidado – estado do sistema operativo convidado, precisa de ferramentas VMware
+ ferramentas – estado das ferramentas VMware
+ problemas – todas as questões para o anfitrião
^ all runtime info(except con and no thresholds)
Host specific :
* cpu – shows cpu info
+ uso – CPU usage in percentage
o quickstats – switch for query either PerfCounter values or Runtime info
+ usagemhz – CPU usage in MHz
o quickstats – switch for query either PerfCounter values or Runtime info
^ all cpu info
o quickstats – switch for query either PerfCounter values or Runtime info
* mem – shows mem info
+ uso – mem usage in percentage
o quickstats – switch for query either PerfCounter values or Runtime info
+ usagemb – mem usage in MB
o quickstats – switch for query either PerfCounter values or Runtime info
+ swap – swap mem usage in MB
o listvm – turn on/off output list of swapping VM’s
+ overhead – additional mem used by VM Server in MB
+ overall – overall mem used by VM Server in MB
+ memctl – mem used by VM memory control driver(vmmemctl) that controls ballooning
o listvm – turn on/off output list of ballooning VM’s
^ all mem info(except overall and no thresholds)
* Rede – shows net info
+ uso – utilização global da rede em KBps(Kilobytes por Segundo)
+ receber – receber em KBps(Kilobytes por Segundo)
+ enviar – enviar em KBps(Kilobytes por Segundo)
+ nic – makes sure all active NICs are plugged in
^ toda a informação da rede(exceto uso e sem limiares)
* io – shows disk io info
+ aborted – aborted commands count
+ resets – bus resets count
+ read – read latency in ms (totalReadLatency.average)
+ escrever – write latency in ms (totalWriteLatency.average)
+ kernel – kernel latency in ms
+ dispositivo – device latency in ms
+ queue – queue latency in ms
^ all disk io info
* vmfs – shows Datastore info
+ (Nome) – free space info for datastore with name (Nome)
o used – output used space instead of free
o brief – list only alerting volumes
o regexp – whether to treat name as regexp
o blacklistregexp – whether to treat blacklist as regexp
b – blacklist VMFS’s
T (valor) – timeshift to detemine if we need to refresh
^ all datastore info
o used – output used space instead of free
o brief – list only alerting volumes
o blacklistregexp – whether to treat blacklist as regexp
b – blacklist VMFS’s
T (valor) – timeshift to detemine if we need to refresh
* Runtime – mostrar informação em tempo de execução
+ com – estado da ligação
+ health – checks cpu/storage/memory/sensor status and propagates worst state
o listitems – listar todos os sensores disponíveis(usar apenas para fins de listagem)
o blackregexpflag – whether to treat blacklist as regexp
b – objetos de estado da lista negra
+ storagehealth – verificação do estado do armazenamento
o blackregexpflag – whether to treat blacklist as regexp
b – objetos de estado da lista negra
+ temperatura – sensores de temperatura
o blackregexpflag – whether to treat blacklist as regexp
b – objetos de estado da lista negra
+ sensor – sensor com limite especificado
+ manutenção – mostra se o host está em modo de manutenção
o maintwarn – define estado de aviso quando o host está em modo de manutenção
o maintcrit – define estado crítico quando o host está em modo de manutenção
+ list(vm) – lista de máquinas VMware e os seus estados
+ estado – estado geral do objeto (cinzento/verde/vermelho/amarelo)
+ problemas – todas as questões para o anfitrião
b – problemas de lista negra
^ all runtime info(health, storagehealth, temperatura e sensor são representados como um valor único e sem limites)
* serviço – mostra informações dos serviços do Host
+ (nomes) – verificar o estado de um ou vários serviços especificados por (nomes), sintaxe para (nomes):<service1>,<service2>,…,<serviceN>
^ mostrar todos os serviços
* storage – mostra informações de armazenamento do Host
+ adaptador – listar adaptadores de barramento
b – adaptadores na lista negra
+ lun – listar unidades lógicas SCSI
b – LUN’s na lista negra
+ Caminho – listar caminhos de unidades lógicas
b – caminhos na lista negra
^ mostrar todas as informações de armazenamento
* Tempo de atividade – mostra tempo de atividade do Host
o quickstats – switch for query either PerfCounter values or Runtime info
* dispositivo – mostra informações específicas do dispositivo do anfitrião
+ cd/dvd – lista de VMs com drives CD/DVD ligados
o listall – lista de todos os dispositivos disponíveis(usar apenas para fins de listagem)
específica do DC :
* cpu – shows cpu info
+ uso – CPU usage in percentage
o quickstats – switch for query either PerfCounter values or Runtime info
+ usagemhz – CPU usage in MHz
o quickstats – switch for query either PerfCounter values or Runtime info
^ all cpu info
o quickstats – switch for query either PerfCounter values or Runtime info
* mem – shows mem info
+ uso – mem usage in percentage
o quickstats – switch for query either PerfCounter values or Runtime info
+ usagemb – mem usage in MB
o quickstats – switch for query either PerfCounter values or Runtime info
+ swap – swap mem usage in MB
+ overhead – additional mem used by VM Server in MB
+ overall – overall mem used by VM Server in MB
+ memctl – mem used by VM memory control driver(vmmemctl) that controls ballooning
^ all mem info(except overall and no thresholds)
* Rede – shows net info
+ uso – utilização global da rede em KBps(Kilobytes por Segundo)
+ receber – receber em KBps(Kilobytes por Segundo)
+ enviar – enviar em KBps(Kilobytes por Segundo)
^ toda a informação da rede(exceto uso e sem limiares)
* io – shows disk io info
+ aborted – aborted commands count
+ resets – bus resets count
+ read – read latency in ms (totalReadLatency.average)
+ escrever – write latency in ms (totalWriteLatency.average)
+ kernel – kernel latency in ms
+ dispositivo – device latency in ms
+ queue – queue latency in ms
^ all disk io info
* vmfs – shows Datastore info
+ (Nome) – free space info for datastore with name (Nome)
o used – output used space instead of free
o brief – list only alerting volumes
o regexp – whether to treat name as regexp
o blacklistregexp – whether to treat blacklist as regexp
b – blacklist VMFS’s
T (valor) – timeshift to detemine if we need to refresh
^ all datastore info
o used – output used space instead of free
o brief – list only alerting volumes
o blacklistregexp – whether to treat blacklist as regexp
b – blacklist VMFS’s
T (valor) – timeshift to detemine if we need to refresh
* Runtime – mostrar informação em tempo de execução
+ list(vm) – lista de máquinas VMware e os seus estados
+ listhost – lista de servidores anfitriões esx VMware e seus estados
+ listcluster – lista de clusters VMware e seus estados
+ ferramentas – estado das ferramentas VMware
b – lista negra de VMware VM's
+ estado – estado geral do objeto (cinzento/verde/vermelho/amarelo)
+ problemas – todas as questões para o anfitrião
b – problemas de lista negra
^ all runtime info(exclui cluster e ferramentas e sem limiares)
* recomendações – mostra recomendações para cluster
+ (Nome) – recomendações para cluster com nome (Nome)
^ todas as recomendações de clusters
Específico do cluster :
* cpu – shows cpu info
+ uso – CPU usage in percentage
+ usagemhz – CPU usage in MHz
^ all cpu info
* mem – shows mem info
+ uso – mem usage in percentage
+ usagemb – mem usage in MB
+ swap – swap mem usage in MB
o listvm – turn on/off output list of swapping VM’s
+ memctl – mem used by VM memory control driver(vmmemctl) that controls ballooning
o listvm – turn on/off output list of ballooning VM’s
^ all mem info(mais overhead e sem limiares)
* Cluster – mostra informações sobre serviços do cluster
+ effective cpu – recursos totais disponíveis de CPU de todos os hosts dentro do cluster
+ effectmem – quantidade total de memória de máquina de todos os hosts no cluster
+ failover – VMware HA número de falhas que podem ser toleradas
+ CPUFAIRNESS – justiça na alocação distribuída de recursos de CPU
+ memfairness – justiça da alocação distribuída de recursos do MEM distribuído
^ apenas valores effectCPU e Effectivemem para serviços do cluster
* Runtime – mostrar informação em tempo de execução
+ list(vm) – lista de máquinas VMware no cluster e seus estados
+ listhost – lista de servidores anfitriões esx VMware no cluster e seus estados
+ estado – estado geral do cluster (cinzento/verde/vermelho/amarelo)
+ problemas – todos os problemas do cluster
b – problemas de lista negra
^ todas as informações de runtime do cluster
* vmfs – shows Datastore info
+ (Nome) – free space info for datastore with name (Nome)
o used – output used space instead of free
o brief – list only alerting volumes
o regexp – whether to treat name as regexp
o blacklistregexp – whether to treat blacklist as regexp
b – blacklist VMFS’s
T (valor) – timeshift to detemine if we need to refresh
^ all datastore info
o used – output used space instead of free
o brief – list only alerting volumes
o blacklistregexp – whether to treat blacklist as regexp
b – blacklist VMFS’s
T (valor) – timeshift to detemine if we need to refresh[/Código-fonte]