
Monitoraggio dello SLA dei servizi controllati di Centreon

Qualcosa di curioso e che a seconda delle circostanze può tornare utile potrebbe essere quello di conoscere lo SLA di qualsiasi servizio che stiamo attualmente monitorando nei nostri centri. Può anche essere progettato per quando monitoriamo a livello aziendale, per dare visibilità alla tua disponibilità.

Come sappiamo, Centreon almacena sus métricas y estados en una BD de MariaDB, podemos sencillamente mediante queries de MySQL sacar en tiempo o en % el estado de un Servicio monitorado en Centreon. Podremos saber cuánto tiempo (o porcentaje) ha estado en estado OK, Avvertimento, Critico, Unknown o en Mantenimiento. Per cosa? Bene, de todos es sabido que podemos conocer el SLA de cualquier Host o Servicio en Centreon, pero otra cosa es monitorarlo para alertarnos de quando este no se cumple, o per esempio para visualizarlos en nuestro Servicio de Negocios via NagVis.
Non male, para comenzar sarebbe interessante che si no stai monitorando query de MySQL, eches un vistazo a Questo post. quando tengas già lo script che permette di fare consultas a BBDD de MySQL, podremo creare i Comandos che necesitamos y ogni uno con il suo tipo di consulta. Poiché alcuni comandi ci serviranno per monitorare lo SLA degli Host, altri dei Servizi, altri ci daranno il risultato in tempo e altri in %, quindi a seconda di ciò di cui hai bisogno ti lascio qui alcune possibilità:
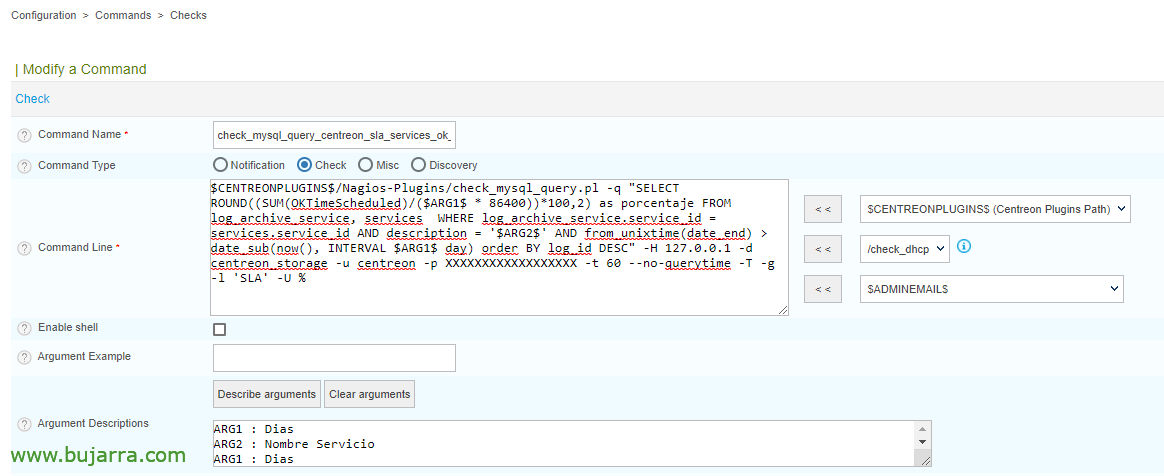
- SLA dei Servizi OK in %:
$CENTREONPLUGINS$/Nagios-Plugins/check_mysql_query.pl -q "SELEZIONA ROUND((SOMMA(OKTimeScheduled)/($ARG1$ * 86400))*100,2) come percentuale DA log_archive_service, services DOVE log_archive_service.service_id = services.service_id E description = '$ARG2$' E from_unixtime(date_end) > date_sub(ora(), INTERVALLO $ARG 1$ giorno) ordinare PER log_id DESC" -H 127.0.0.1 -d centreon_storage -u centreon -p PASSWORD_UTENTE_CENTREON -t 60 --no-querytime -T -g -l 'SLA' -U %
- SLA dei Servizi OK in Tempo:
$CENTREONPLUGINS$/Nagios-Plugins/check_mysql_query.pl -q "SELEZIONA CONCAT(PAVIMENTO(ORA(sec_to_time(SOMMA(OKTimeScheduled))) / 24), 'd_', MOD(ORA(sec_to_time(SOMMA(OKTimeScheduled))), 24), 'h_', MINUTO(sec_to_time(SOMMA(OKTimeScheduled))), 'm') COME Tempo DA log_archive_service, services DOVE log_archive_service.service_id = services.service_id E description = '$ARG2$' E from_unixtime(date_end) > date_sub(ora(), INTERVALLO $ARG 1$ giorno) ordinare PER log_id DESC" -H 127.0.0.1 -d centreon_storage -u centreon -p PASSWORD_UTENTE_CENTREON -t 60 --no-querytime -T -g -l 'SLA'
- SLA dei Servizi Warning in %:
$CENTREONPLUGINS$/Nagios-Plugins/check_mysql_query.pl -q "SELEZIONA ROUND((SOMMA(WARNINGTimeScheduled)/($ARG1$ * 86400))*100,2) come percentuale DA log_archive_service, services DOVE log_archive_service.service_id = services.service_id E description = '$ARG2$' E from_unixtime(date_end) > date_sub(ora(), INTERVALLO $ARG 1$ giorno) ordinare PER log_id DESC" -H 127.0.0.1 -d centreon_storage -u centreon -p PASSWORD_UTENTE_CENTREON -t 60 --no-querytime -T -g -l 'SLA' -U %
- SLA dei Servizi Warning in Tempo:
$CENTREONPLUGINS$/Nagios-Plugins/check_mysql_query.pl -q "SELEZIONA CONCAT(PAVIMENTO(ORA(sec_to_time(SOMMA(WARNINGTimeScheduled))) / 24), 'd_', MOD(ORA(sec_to_time(SOMMA(WARNINGTimeScheduled))), 24), 'h_', MINUTO(sec_to_time(SOMMA(WARNINGTimeScheduled))), 'm') COME Tempo DA log_archive_service, services DOVE log_archive_service.service_id = services.service_id E description = '$ARG2$' E from_unixtime(date_end) > date_sub(ora(), INTERVALLO $ARG 1$ giorno) ordinare PER log_id DESC" -H 127.0.0.1 -d centreon_storage -u centreon -p PASSWORD_UTENTE_CENTREON -t 60 --no-querytime -T -g -l 'SLA'
- SLA dei Servizi Critical in %:
$CENTREONPLUGINS$/Nagios-Plugins/check_mysql_query.pl -q "SELEZIONA ROUND((SOMMA(CRITICALTimeScheduled)/($ARG1$ * 86400))*100,2) come percentuale DA log_archive_service, services DOVE log_archive_service.service_id = services.service_id E description = '$ARG2$' E from_unixtime(date_end) > date_sub(ora(), INTERVALLO $ARG 1$ giorno) ordinare PER log_id DESC" -H 127.0.0.1 -d centreon_storage -u centreon -p PASSWORD_UTENTE_CENTREON -t 60 --no-querytime -T -g -l 'SLA' -U %
- SLA dei Servizi Critical in Tempo:
$CENTREONPLUGINS$/Nagios-Plugins/check_mysql_query.pl -q "SELEZIONA CONCAT(PAVIMENTO(ORA(sec_to_time(SOMMA(CRITICALTimeScheduled))) / 24), 'd_', MOD(ORA(sec_to_time(SOMMA(CRITICALTimeScheduled))), 24), 'h_', MINUTO(sec_to_time(SOMMA(CRITICALTimeScheduled))), 'm') COME Tempo DA log_archive_service, services DOVE log_archive_service.service_id = services.service_id E description = '$ARG2$' E from_unixtime(date_end) > date_sub(ora(), INTERVALLO $ARG 1$ giorno) ordinare PER log_id DESC" -H 127.0.0.1 -d centreon_storage -u centreon -p PASSWORD_UTENTE_CENTREON -t 60 --no-querytime -T -g -l 'SLA'
- SLA degli Host Uptime in %:
$CENTREONPLUGINS$/Nagios-Plugins/check_mysql_query.pl -q "SELEZIONA ROUND((SOMMA(UPTimeProgrammato)/($ARG1$ * 86400))*100,2) in percentuale FROM host, log_archive_host DOVE log_archive_host.host_id = hosts.host_id E hosts.name = '$ARG 2$' E from_unixtime(date_end) > date_sub(ora(), INTERVALLO $ARG 1$ giorno) ordina PER date_end DESC" -H 127.0.0.1 -d centreon_storage -u centreon -p PASSWORD_UTENTE_CENTREON -t 60 --no-querytime -T -g -l 'SLA' -U %
- SLA degli Host Uptime in Tempo:
$CENTREONPLUGINS$/Nagios-Plugins/check_mysql_query.pl -q "SELEZIONA CONCAT(PAVIMENTO(ORA(sec_to_time(SOMMA(UPTimeProgrammato))) / 24), 'd_', MOD(ORA(sec_to_time(SOMMA(UPTimeProgrammato))), 24), 'h_', MINUTO(sec_to_time(SOMMA(UPTimeProgrammato))), 'm') AS Tiempo FROM padroni di casa, log_archive_host DOVE log_archive_host.host_id = hosts.host_id E hosts.name = '$ARG 2$' E from_unixtime(date_end) > date_sub(ora(), INTERVALLO $ARG 1$ giorno) ordina PER date_end DESC" -H 127.0.0.1 -d centreon_storage -u centreon -p PASSWORD_UTENTE_CENTREON -t 60 --no-querytime -T -g -l 'SLA'
- SLA di inattività degli host in %:
$CENTREONPLUGINS$/Nagios-Plugins/check_mysql_query.pl -q "SELEZIONA ROUND((SOMMA(INATTIVITÀ programmata)/($ARG1$ * 86400))*100,2) in percentuale FROM host, log_archive_host DOVE log_archive_host.host_id = hosts.host_id E hosts.name = '$ARG 2$' E from_unixtime(date_end) > date_sub(ora(), INTERVALLO $ARG 1$ giorno) ordina PER date_end DESC" -H 127.0.0.1 -d centreon_storage -u centreon -p PASSWORD_UTENTE_CENTREON -t 60 --no-querytime -T -g -l 'SLA' -U %
- SLA di inattività degli host in tempo:
$CENTREONPLUGINS$/Nagios-Plugins/check_mysql_query.pl -q "SELEZIONA CONCAT(PAVIMENTO(ORA(sec_to_time(SOMMA(INATTIVITÀ programmata))) / 24), 'd_', MOD(ORA(sec_to_time(SOMMA(INATTIVITÀ programmata))), 24), 'h_', MINUTO(sec_to_time(SOMMA(INATTIVITÀ programmata))), 'm') AS Tiempo FROM padroni di casa, log_archive_host DOVE log_archive_host.host_id = hosts.host_id E hosts.name = '$ARG 2$' E from_unixtime(date_end) > date_sub(ora(), INTERVALLO $ARG 1$ giorno) ordina PER date_end DESC" -H 127.0.0.1 -d centreon_storage -u centreon -p PASSWORD_UTENTE_CENTREON -t 60 --no-querytime -T -g -l 'SLA'
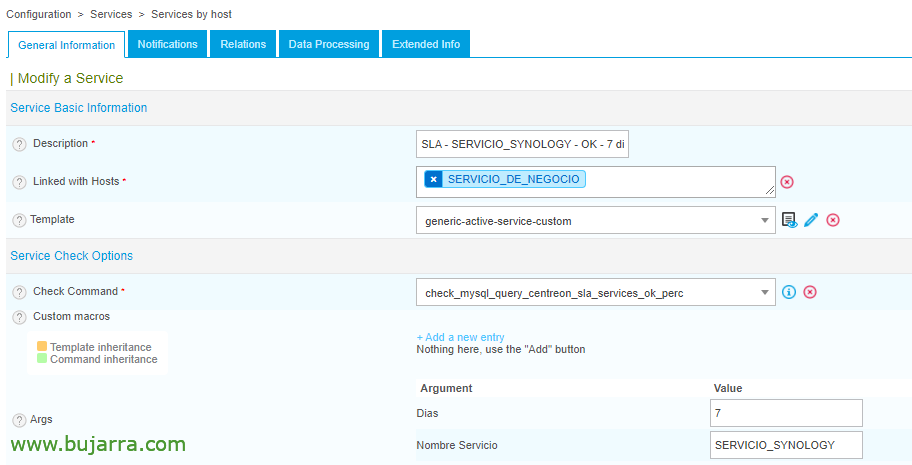
E ora manca solo creare tanti Servizi per monitorare lo SLA quanto ci interessa, in questo caso pratico, io li sto usando solo per misurare lo SLA dei Servizi di Business, e quindi per visualizzarli in NagVis. Come argomenti metteremo i giorni dello SLA che ci interessa vedere e nel Nome del Servizio, il nome unico di un Servizio da controllare.

E come sempre, dopo aver salvato ed esportato la configurazione, avremo i nostri servizi SLA pronti per essere controllati tramite una query nel database di Centreon il tempo o la percentuale dello stato di un Servizio.
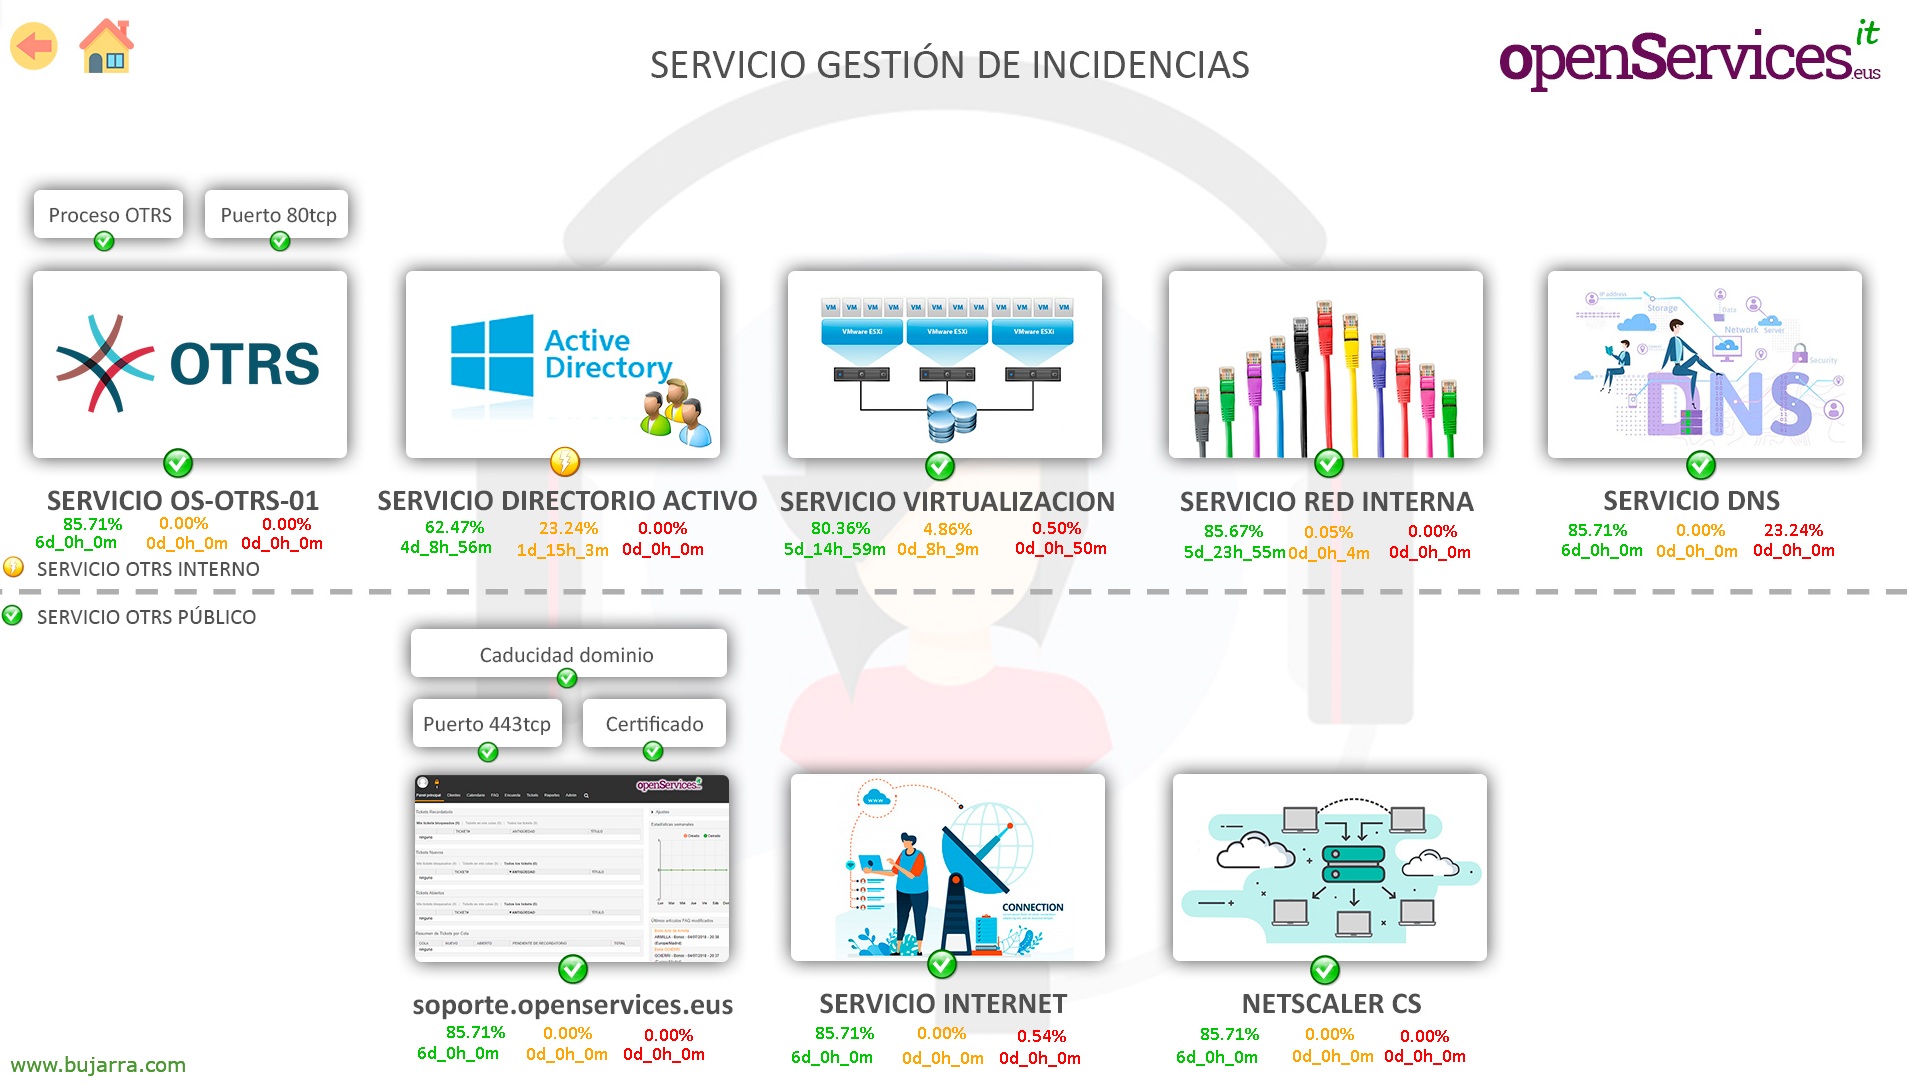
E in NagVis, con el Gadget de RawNumbers podremos añadir los ítems SLA monitorizados y quedará más atractivo a la hora de movernos entre mapas y conocer el SLA que ofrece cualquier servicio, ideal para perfiles no 100% técnicos y quieran conocer el estado de su infraestructura en tiempo real.