SpiceWorks Installation and Configuration

SPICEWORKS is a completely free software that generates useful information from your organization's LAN, Getting statistics on how many devices are on the network, how many PCs, Servers, Printers, Switches… And from each one he gets all the information possible, what operating system does it have?, what software/patches you have installed, Your Setup, Physical Data… and the interesting part would be the alerts. Alerts can be generated and we can be notified when there is a, for example, that it does not have AntiVirus, disk space, Fallen services… First of all, get this software, Its website is: www.spiceworks.com.
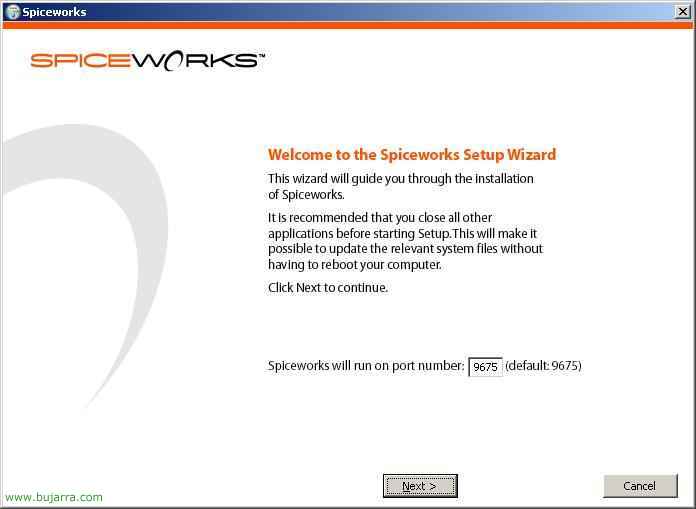
We download and install it, Start an Assistant, As we can see, it will open a port for us, the 9675 Default. So we can connect with a browser to this application from any PC, We give “Next”,
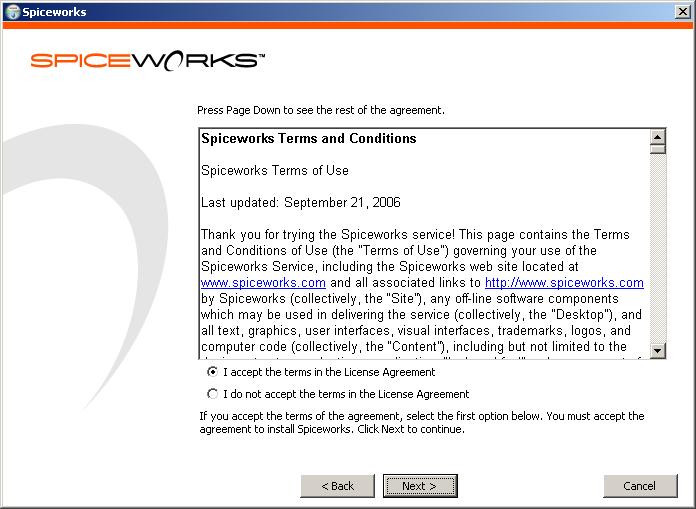
We accept the license “I accept the terms in the License Agreement” and we continue “Next”

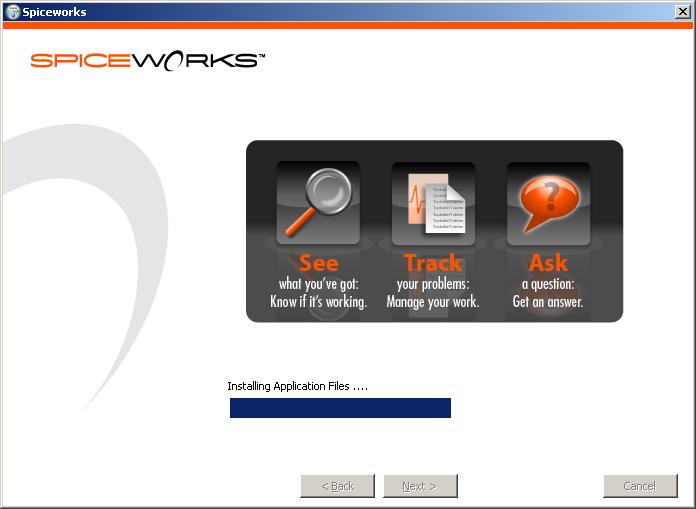
The default path where the app will install, If we want, we can change it. Click on “Install” to start installing it.
…
GOOD, Ends correctly, Click on “Next”
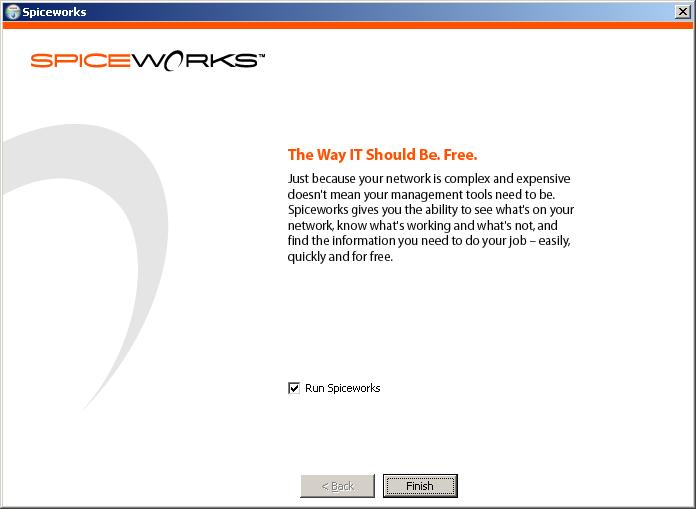
“Finish”
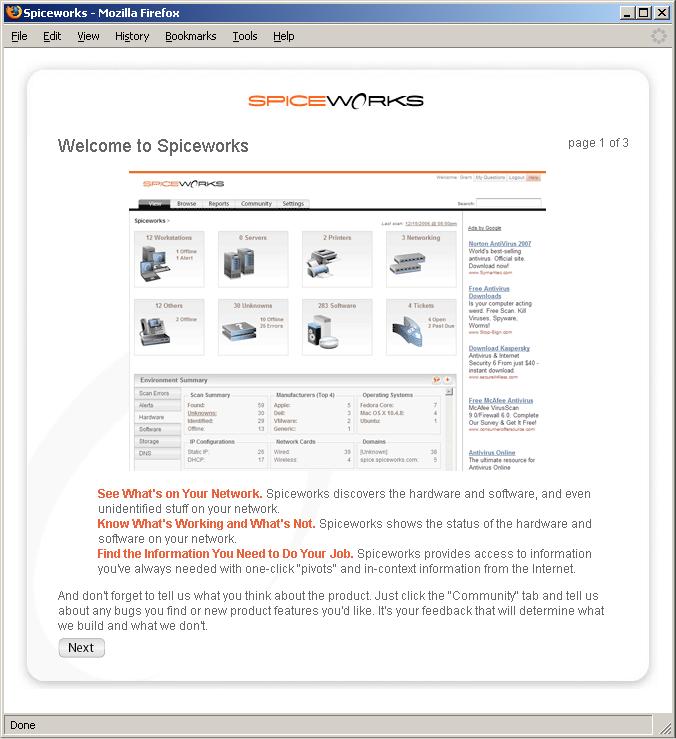
GOOD, you have already installed it, Here we have a setup wizard, We have to register, It's just for statistics and to check how many people use your product, Click on “Next”,
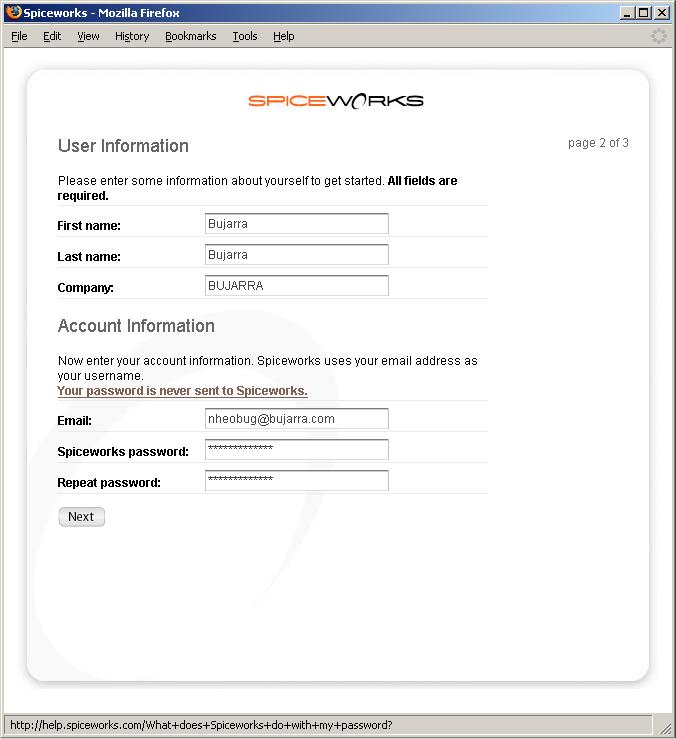
We enter our data, The important thing is the email with your password so that you can log in to the console later, Then we press “Next”,
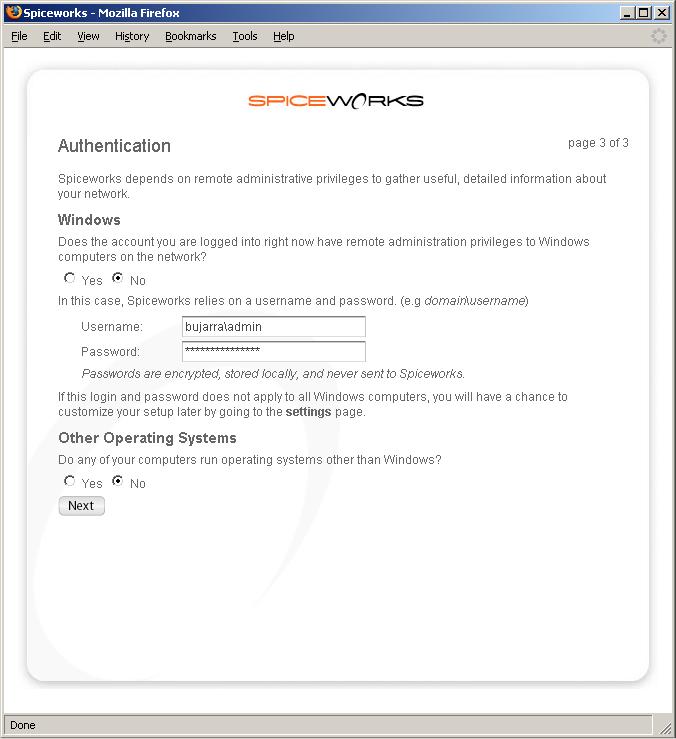
If we currently have privileges with the account we installed on the SpiceWorks, We say yes, otherwise, We put the domain administrator's account next to the domain (DOMAINadministrator), Continue “Next”
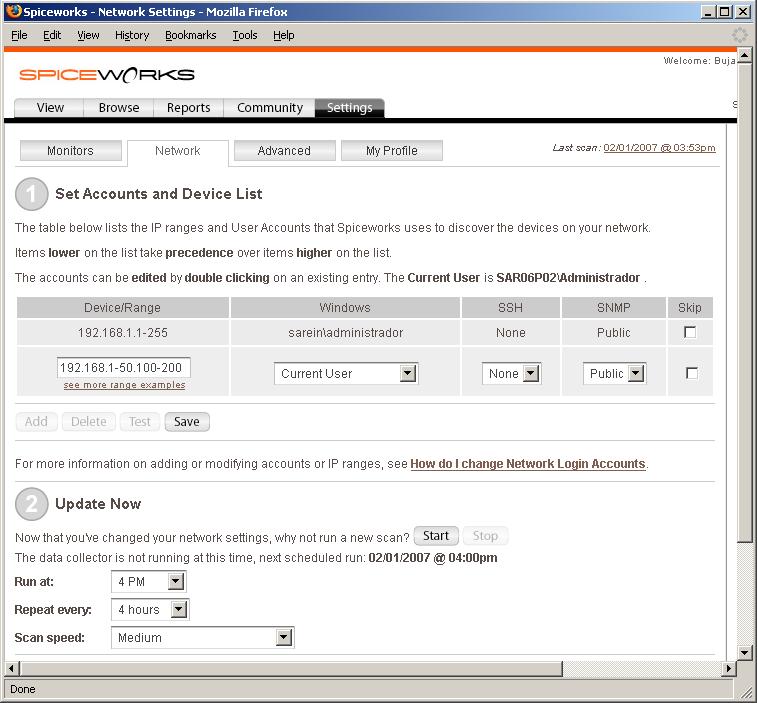
In “Device/Range” we set the range that we want the network to analyze, normally our company IP range, in “Windows” The Privileged Account”; if we have a Unix system we will configure SSH to also extract information from it. We record the information with “Save” and at the point 2 We configure how often we want it to do scans, and what time do we want it to start, The normal way to not generate a lot of bandwidth and to have updated information is between 4 and 8 hours. Once we have it, We save it and start a scan to check what we have on the network by clicking on “Start”,
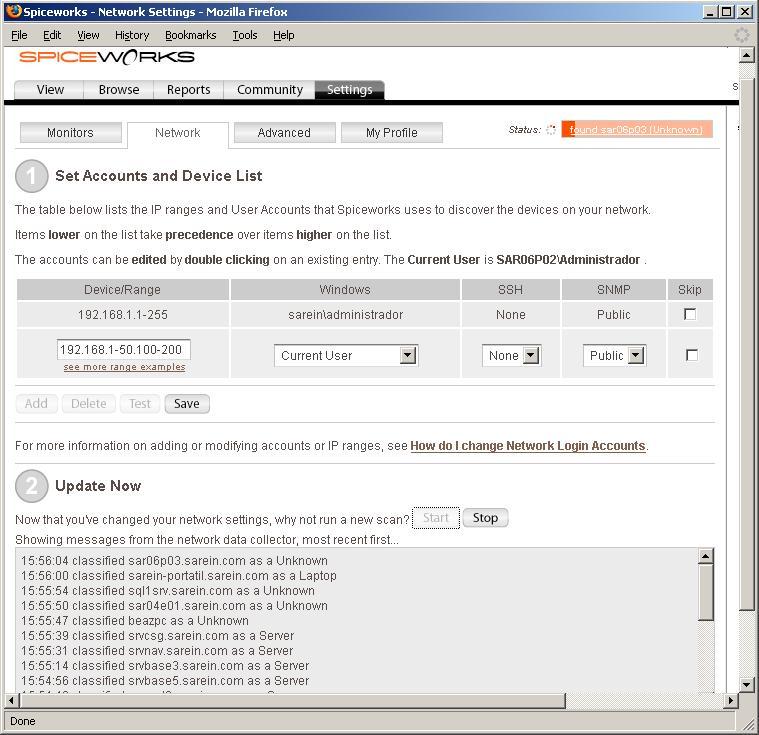
The analysis has already begun, we see that he is taking equipment out of the net and up in “Status” The % completed, wait a while for him to complete a 100%.
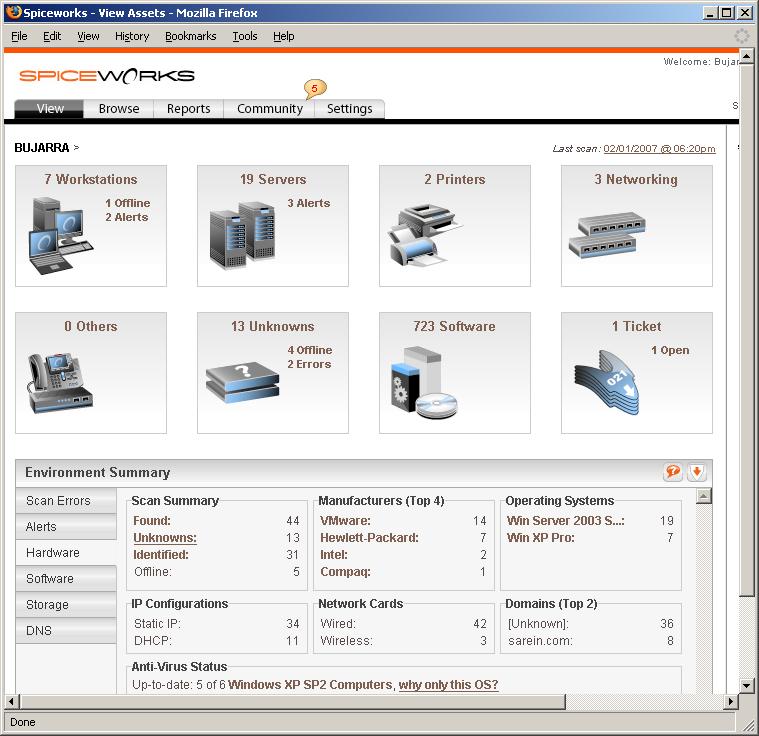
Once it's over, in “View”, A summary of everything we have in our network comes, how many PCs, Servers, Printers… and so on, even those who come as “Unknowns” We can move them to whatever object group it is (Telephone switchboards, Switches…), and at the bottom we can see a summary of Operating Systems, Hardware Manufacturers…
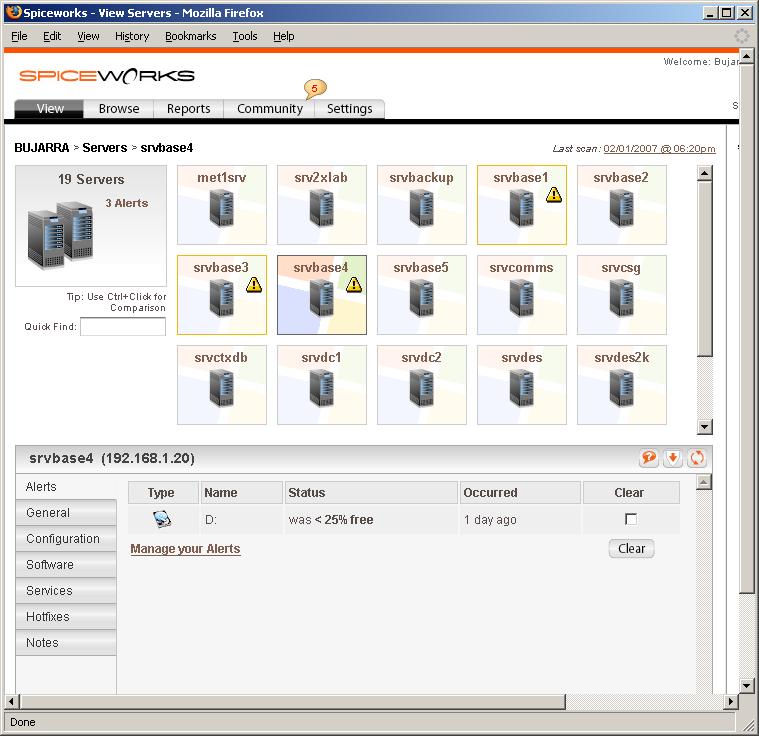
If we enter into any section, We see the teams we have, For example, here we see the servers that my network has and those that it flags with alert. Let's see what configuration they have, Installed Programs, Running Services, Patches installed… In this example, We see that a server has an alert, and that is because the disc has less than a 25% free.
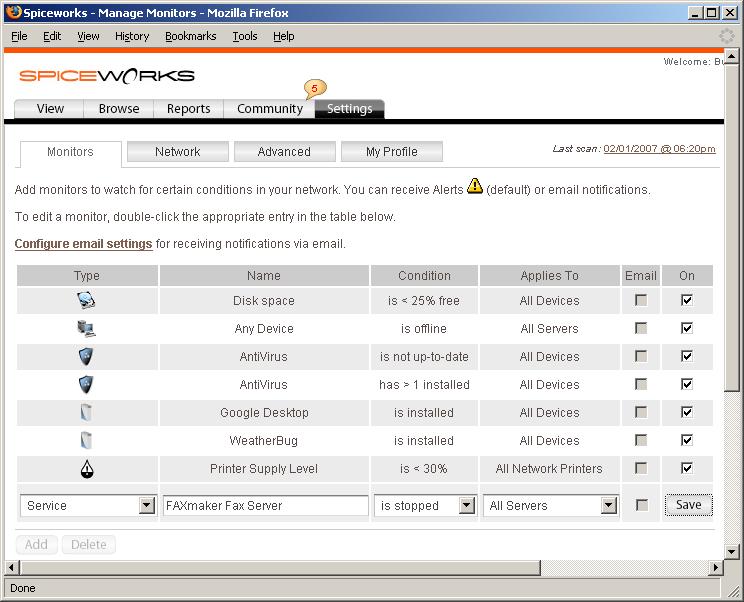
If we want, We can customize these alerts, To do this, we are going to “Settings” > “Monitors” and there we will see what there is, we can remove them and add new ones or modify existing ones. For example, I am interested in knowing when a service is down from a server, Well, we created a new alert, we indicate that it is of the “Service” and in “Name” We start typing the name of the service we are interested in monitoring, For example, the “FAXmaker Fax Service” (when you start typing the service you are interested in, we will get all the ones that have detected us on the PCs/servers), We indicate the condition, That he is standing “is stopped” and we apply it to all servers for example, We keep it in “Save” and when it finds it stopped it will mark the server with an alert, or if we want (better) You can configure it to send us alerts by email, via email by clicking on “Configure Email Settings”.
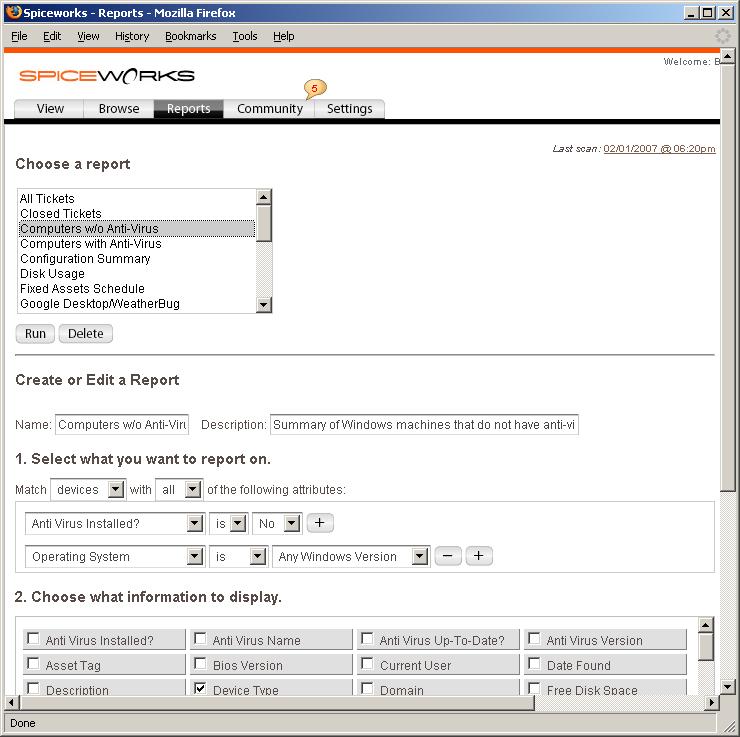
In addition, if we want, we can get reports of whatever we want, you have some by default or else, we create them ourselves. To do this,, first, Click on “Reports”, and on the report that interests us is to click directly on “Run”. If we want, we can create a new one at the bottom, indicating the conditions that interest us, We will save it from “Save”.
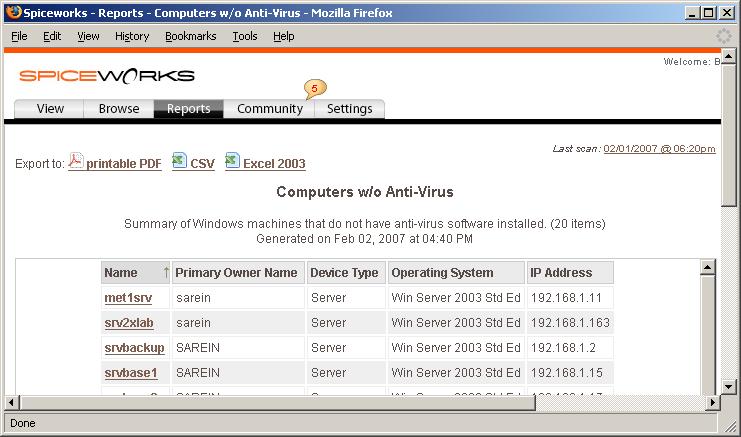
GOOD, If we run one of these reports, shows us a report on WEB, but we can release it in PDF format “printable PDF” or also in an Excel format “Excel 2003”, It's okay if we have to present some kind of report or we have to use comparisons on server crash times…

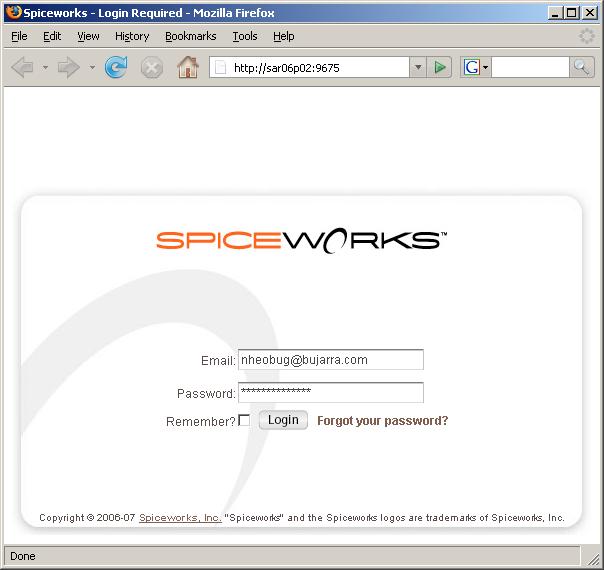
Good to open the Spiceworks leaves us a shortcut on the desktop, And if not, The interesting thing is to open it via the web using the 9675 via the web console.