Deploying Prometheus & Grafana

We wake up from hibernation! Let's start if you think it's okay to tod@s with this document that we will use as a basis in future posts. I had thought that this year we are going to emphasize metrics and logs (Apart from the usual), so I think this document on how to quickly deploy Prometheus and Grafana can come in handy.
Before you begin, Well, that's it, that the Christmas holidays were long for me… I like this thing about holidays and long weekends =) But, well, I want to tell you that I have already prepared the basis for what we will be seeing this year on the blog, I hope you find it interesting; It will be as usual, A little bit of everything, whenever possible 2 Weekly Posts, but focusing on things that have not yet been developed much in the blog, things that are perhaps easy to implement and contribute a lot to give visibility to the environment. Open suggestions in my email. Oh and you can also SPAM Fede Cinalli to return to the Podcast 🙂
We start! What I said, today a first initial document, where we will be able to see how easy it is to deploy Prometheus and Grafana. I understand that both solutions are known, Prometheus is open source and will allow us to store different metrics to visualize them elegantly with Grafana. The idea is to set up a complete telemetry system that allows us to know the status of the systems that we consider to be core business.
In the examples that we will see, we will always use Docker containers (for all the advantages they can give us when installing, update, manage…), so both Prometheus and Grafana will go in their own containers. Usually the posts are based on Ubuntu Server, where apart from the base configuration, you have to have Docker installed.
Deploying Prometheus
To deploy the first container, If that's okay with you, We'll create a folder, Inside it we will leave the docker-compose.yaml with the definition of the container that we are going to deploy, And then, lo desplegaremos.
cd mkdir prometheus cd prometheus mkdir prometheus
We create and edit the container with 'nano docker-compose.yaml’
version: '3.8' Services:
  Prometheus:
    image: Prom/Prometheus container_name: Prometheus restart: unless-stopped command:
      - '--config.file=/etc/prometheus/prometheus.yml'
      - '--storage.tsdb.retention.time=15d' volumes:
      - ./Prometheus:/etc/prometheus
      - prom_data:/promise us ports:
      - 9090:9090
    Networks:
      prometheus_default:
Volumes:
  prom_data:

Networks:
  prometheus_default:
    driver: Bridge Ipam:
     config:
       - Subnet: XX.XX.XX.0/24
         Gateway: XX.XX.XX.1
We will create a container that will be called prometheus, based on this image, that will expose (Default) port 9090tcp to which we can connect later. (In my case) We passed it 2 Commands, one to pass you the Prometheus configuration file (prometheus.yml) and another to indicate that I want a withholding of 15 days (if we want). As well as the network, I particularly like to assign ranks, Tell them, or omit the 4 Last lines.
And before you start the container, we must create its configuration file, for this, We simply run 'Nano Prometheus/prometheus.yml’ and we define it:
global:
  scrape_interval: 5scrape_timeout: 5evaluation_interval: 5s #scrape_configs:
#  - job_name: Prometheus
#    honor_timestamps: True
#    scrape_interval: 15s
#    scrape_timeout: 10s
#    metrics_path: /Metrics
#    scheme: HTTP
#    static_configs:
#      - Targets:
#        - localhost:9090
In my case, you will see what I have commented (#) Don't let me get caught by local metrics, of the Prometheus container itself, I'm not interested in them, But for tastes, 🙂 If you don't have metrics to test with, You uncomment on it.
And now we would only have to unfold the container, Running:
sudo docker compose up -d
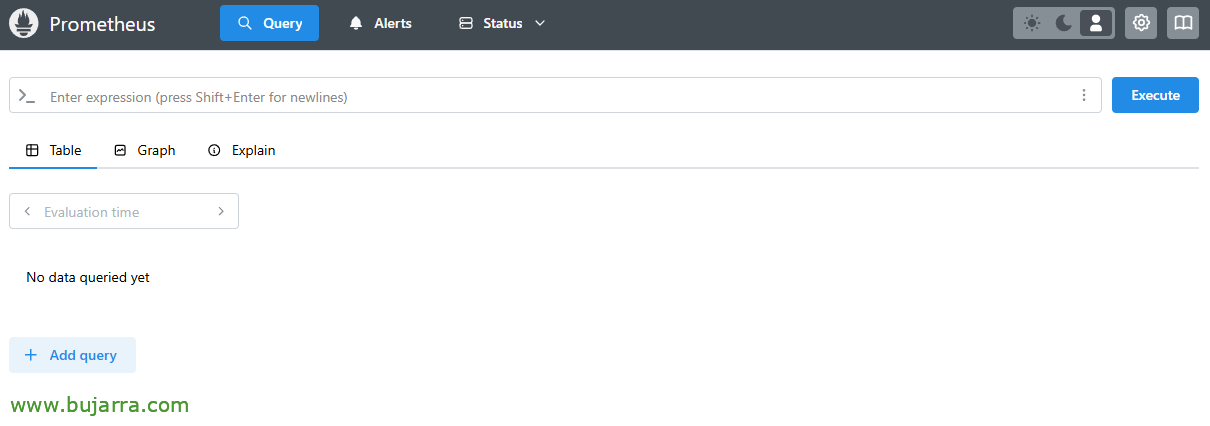
Once you download the Prometheus image, it will lift the container and we can connect to the GUI if we want to confirm that everything has gone well (remember, to 9090tcp). Remember that if you don't get along with Docker commands, we will always have Portainer; But wow, in this case if you have followed the steps well, The container will have been lifted, And if not, You look at the logs 'sudo docker logs prometheus -f'.
Deploying Grafana
Just like Prometheus, Grafana will go in another Docker container, It's that easy and simple. We create a folder where we're going to leave the docker compose and then deploy it:
cd mkdir grafana cd grafana
And we created there with 'nano docker-compose.yaml’ the definition of the Grafana container we want:
Services:
  Grafana:
    image: Grafana/Grafana-OSS container_name: Grafana Restart: unless-stopped ports:
     - '3000:3000' volumes:
      - ./grafana-storage:/var/lib/grafana networks:
      - grafana_default volumes:
  grafana-storage: {}

Networks:
  grafana_default:
    driver: Bridge Ipam:
     config:
       - Subnet: XX.XX.XX.0/24
         Gateway: XX.XX.XX.1
That the latest image from Grafana Open Source will be downloaded, and will issue it by port 3000tcp.
At last, we unfold and start the container with:
sudo docker compose up -d
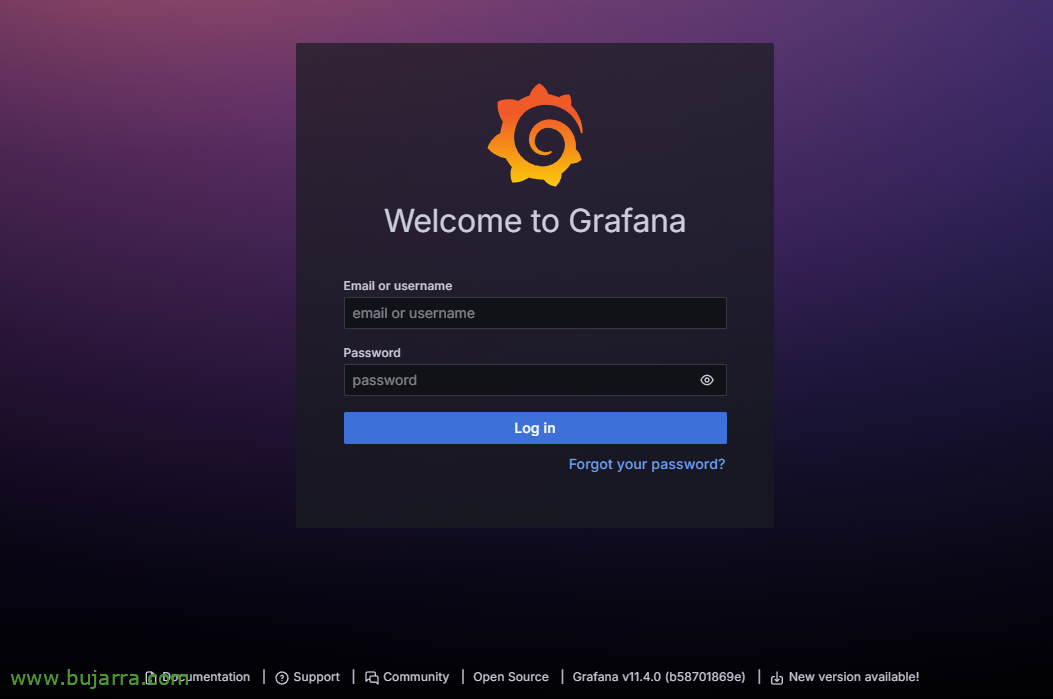
Open a browser against port 3000tcp of the Docker machine and you will have Grafana running. We log in as an admin / admin by default, and we will make sure to change the password.

We finish the document by creating the Data source in Grafana, which will be the connector against Prometheus, Let's go to 'Home’ > 'Connections’ > 'Data sources’ > 'Add new data source', and we added one of the Prometheus type. We give the data source a name and indicate the URL of our Prometheus.
From now on, we will now be able to start storing metrics in Prometheus, and view them from Grafana, well since we make the Dashboards ourselves, or directly take them from the Grafana 🙂 community
That's all for today, We start with the pillars =) I hope that as always you do great, and that this time has helped us to mature a little more! I send you a hug, Take good care of yourselves!