Ping metrics with Prometheus and Grafana

A simple post, that I believe can contribute in any area, And it's nothing more than pinging 😊😂, Let's see I laugh, but it provides interesting information on many occasions. In this post we will see how to send pings to internal/external IP addresses that we are interested in knowing their latency, if there are cuts… and understand it visually with Grafana.
If we were interested in knowing in real time (at the level of 1 second, 5…) connectivity to certain IP addresses, to know minimally when we have a network problem, whether we don't reach the Internet, a service that we have published, or internal IP addresses of delegations, Datacenter… IP addresses we will be interested in knowing about (i) if packages fall and (Ii) Your Response Time (to know latencies). In this post we will see how in a very simple and fast way we have it assembled.
As I told you, This year I intend to emphasize a little this type of topics that we have not yet touched on much in the blog, especially those that are easy to deploy and apply to a majority 🙂 So let's start! Assuming that we already have in our environment deployed a Prometheus and a Grafana, We can get started.
The most effective way will be to deploy another Docker container, In this case we will use 'ping-exporter’ that in a jiffy will allow us to ping and visualize its data in a Grafana dashboard, We create the folder and we get in:
cd mkdir ping-exporter mkdir ping-exporter/config cd ping-exporter
We create the docker compose configuration file for this container with 'nano docker-compose.yaml’
version: '3.9' Services:
    ping_exporter:
        image: czerwonk/ping_exporter container_name: ping_exporter volumes:
            - './config:/config:ro' ports:
            - '9427:9427' Restart: unless-stopped networks:
           ping_exporter_default:

Networks:
  ping_exporter_default:
    driver: Bridge Ipam:
     config:
       - Subnet: XX.XX.XX.0/24
         Gateway: XX.XX.XX.1
Where you'll create a container called ping_exporter, based on the image of ping_exporter, which will mount the config folder and expose the pings metrics on port 9427tcp, particularities of mine that I like to define specific network ranges, otherwise, I skipped the last ones 4 lines.
The next step, will be to create the configuration file for ping_exporter, I leave you with this example:
Targets:
  - 8.8.8.8
  - 1.1.1.1
  - 192.168.0.1
  - 192.168.1.1

ping:
  interval: 5s timeout: 5s history-size: 42
  payload-size: 120

options:
  disableIPv6: True
How do you see, Within the 'Targets' section’ we can add the IP addresses we want to ping,. As well as the default parameters, however to do the pings every 5 Seconds, Define a timeout, Size… Before anything, I forgot, I leave you the Official Link of the project in case you want to have more information.
With this we have it, All that remains is to unfold the container and get it up and running, for this:
sudo docker compose up -d
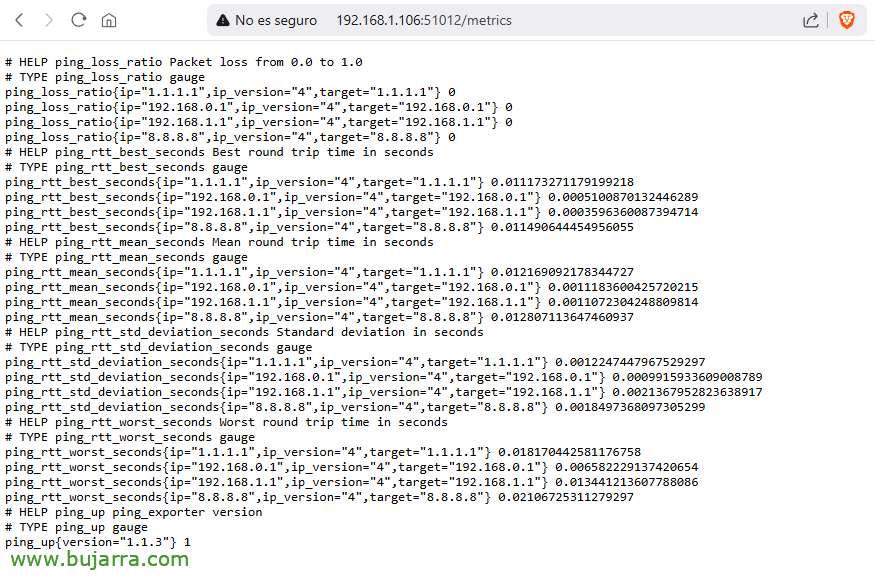
Once the container is deployed, we will be able to verify that it will already be exposing the metrics of the PINGs, for this, if we connect from a browser with http to the Docker IP address, to the port of ping_exporter (9427TCP by default) and put the end of the URL '/metrics'.
Now what we have left, will be to instruct Prometheus to ingest those metrics, for this, it will be as simple as editing the Prometheus configuration file (For example: 'nano~/prometheus/prometheus/prometheus.yml’ and we add a job to connect to the IP and port of the ping_exporter:
...
  - job_name: ping-prometheus scrape_interval: 5scrape_timeout: 5static_configs:
      - Targets:
        - DIRECCION_IP_DOCKER:PUERTO_PING_EXPORTER
...
By default it will connect each 5 Seconds.
And don't forget to restart the Prometheus container to reload the settings:
sudo Docker Restart Prometheus
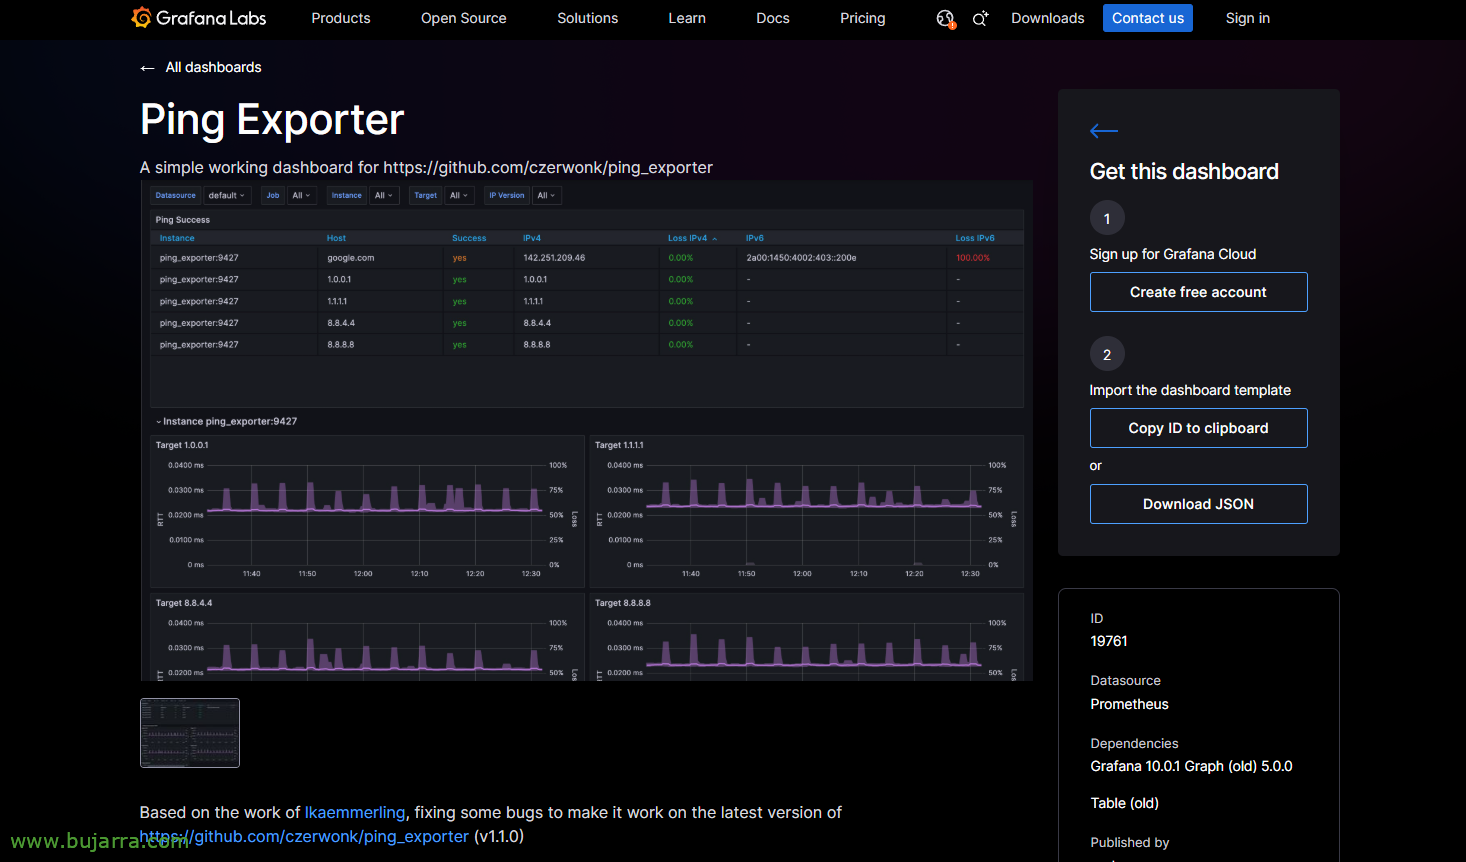
And that's it, We already have it!! What do we have left? Well, see it in Grafana 😊. To do this,, assuming that we follow the steps of the previous document, we have already deployed Grafana and created the data source against Prometheus, Well, it's just that we'll have to import a dashboard that we like and that the community has made, for example I recommend this ID: 19761. So at Grafana, it will be nothing more than hitting in Dashboards > New > Import > Paste the ID and the dashboard will be imported, it will ask you to name the Dashboard and choose the Prometheus connector. From there you are ready!
From there you can customize the dashboard to your liking if you consider it, or whatever you need. But wow, you will see that in a moment you have a dashboard where it will be easy to interpret if an IP address has had a problem during a particular period of time, as well as if packets are dropped or we want to see latency times, Better times, average or worse results. To taste the colors that are simple pings.
On some occasions, thanks to this type of information, we have been able to determine when a WAN was going wrong, or when there is a network electronics problem, and from a switch packets fall, as it may have some problem/burden…
As Kristian Pielholf would say in Bricomanía… easy, Simple and family-friendly 🤣, I hope as always that you have found it interesting and with tips from these and others we can get to know and master our infrastructures.
I send you a hug, Carry yourself well 😉