FortiGate metrics with Prometheus and Grafana

For all of us who have one or more FortiGates in our hands, if we want to see the real-time metrics of these devices with Prometheus, In a few steps we will have it fully functional. Metrics that we will visualize in beautiful Grafana dashboards!
What was said a few days ago, This year we will give a boost to the collection of metrics, Logs and traces with different solutions, Today it's time for something simple (really), it's just taking FortiGate's metrics, store them in Prometheus and view them in Grafana, for this, Need The base that we saw earlier.

Here are some example images of the type of information you can obtain, with metrics at the 1 second, 5 Seconds… At the end of this post, You will have this same info. Load Data, CPU, Memory, Sessions…
Real-time firewall network interface status and usage,
Using Real-Time Firewall Rules, and many other things…
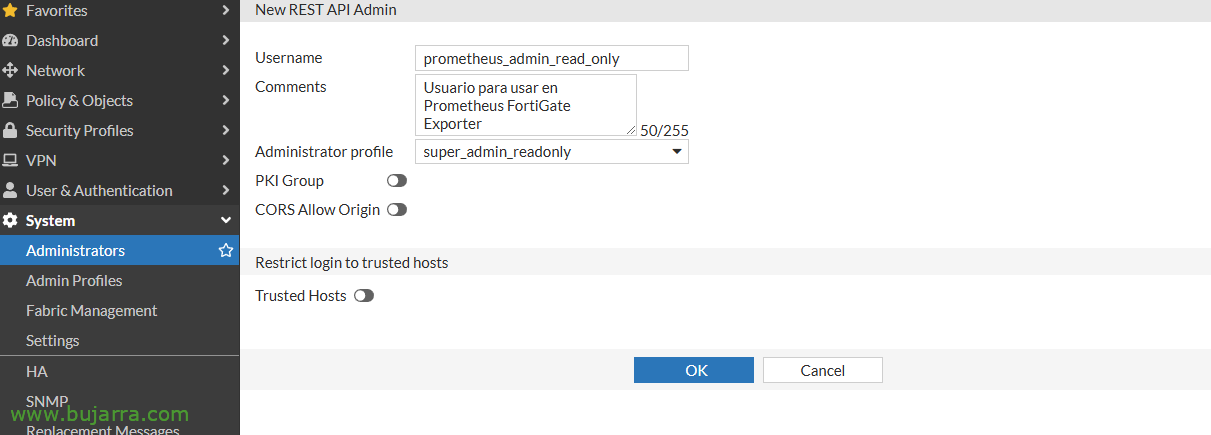
Start, in this case we will use FortiGate Exporter, a metrics exporter for Prometheus, in this case we will quickly deploy it under a Docker container. Before anything, we will need to create a user in our FortiGate that has system read permissions. To do this,, from the FortiGate we will create a 'REST API Admin’ from System > Administrators. In the 'Administrator profile'’ we will indicate that it is 'super_admin_readonly’ and without PKI Group; watch out that when you click on OK it will give us its Token that we must write down.
Let's start, Downloading FortiGate Exporter:
cd git clone https://github.com/bluecmd/fortigate_exporter.git CD fortigate_exporter
Inside the folder we create the file 'fortigate-key.yaml’ with the following content, taking into account to indicate the IP address of the FortiGate, The token we have obtained, and we will be able to comment on metrics that we do not use so that it does not try to obtain them:
"https://DIRECCION_IP_FORTIGATE":
  Token: TOKEN_DEL_ADMIN_READ_ONLY probes:
    exclude:
      - Wifi
      - System/SDNConnector
      #- Log/Fortianalyzer/Status
      #- Log/Fortianalyzer/Queue
      - Log/Fortianalyzer
      - VirtualWAN
      - Switch
      #- Switch/ManagedSwitch
      - System/SensorInfo
And we finish by creating the definition file of the container that we are going to deploy, We created 'docker-compose.yml’
version: '3'  services:
  prometheus_fortigate_exporter:
    build: ./
    ports:
      - 9710:9710
    Volumes:
      - ./fortigate-key.yaml:/config/fortigate-key.yaml command: ["-auth-file", "/config/fortigate-key.yaml", "-Insecure"]
    Restart: unless-stopped networks:
      fortigate_exporter_default:

Networks:
  fortigate_exporter_default:
    driver: Bridge
And with this we have it ready, Now we only have to deploy the container by running:
sudo docker compose up -d

Once the container is deployed, it will connect to the FortiGate and expose its metrics on port 9710tcp, we can confirm this if we open a browser against the Docker IP, something like: HTTP://DIRECCION_IP_DOCKER:9710/metrics The question will be, which we must now indicate to our Prometheus, that connects to this exporter and stores its metrics.
To do this,, as we edit the configuration file of our Prometheus (nano~/prometheus/prometheus/prometheus.yml) and we will add the job in the scrape_configs section:
global:
  scrape_interval: 5scrape_timeout: 5evaluation_interval: 5scrape_configs:
  - job_name: 'fortigate_exporter'     metrics_path: /I tried static_configs:
      - Targets:
        - https://DIRECCION_IP_FORTIGATE
        #- https://my-other-fortigate:8443
    relabel_configs:
      - source_labels: [__address__]
        target_label: __param_target
      - source_labels: [__param_target]
        target_label: instance
        # Drop the https:// and port (if specified) for the 'instance=' label         regex: '(?:.+)(?::\/\/)([^:]*).*'
      - target_label: __address__ replacement: 'DIRECCION_IP_DOCKER_FORTIGATE_EXPORTER:9710'
And for Prometheus to reload the data, Don't forget to restart Prometheus:
sudo Docker Restart Prometheus

With this we already have the FortiGate metrics stored on our Prometheus server, What we would have left, It's the beautiful part. In this case, visualize these metrics from Grafana. To do this,, It will be enough to import a dashboard already developed by the community (Thank you) that we can use in a jiffy. From Grafana, by clicking on create a dashboard, we will tell you that we want to import it and indicate the ID 14011. With that we will have it ready!
As usual, I hope you find it useful, and may it go well and behave better 🤠, The truth is that there are many curious things that we can exploit, I hope to take time and at least put things that are quick and easy to implement. A hug!