Reading the home water meter with ESPHome and Home Assistant

I wanted to write this post, I have been looking for a good solution for a long time, Stable and reliable… And of course, ESPHome has the answer. In this post we will see how to read the water consumption of a regular water meter, Let's go, The one we have at home; and visualize it with Home Assistant.
For years this topic has made me curious, Know the consumption, in this case of the water at home, the consumption and use we make of water in our homes. I had been using solutions with a camera and OCR text recognition, but… It was not a valid solution, It had its weak points and missed more than a fairground shotgun. After a few months of use I can assure you that the most reliable way is with an inductive proximity sensor and a ESP8266 or ESP32.
¿For what? Well, for whatever reason you have, to know consumption, try to save, Detect leaks, Because you can…
 |
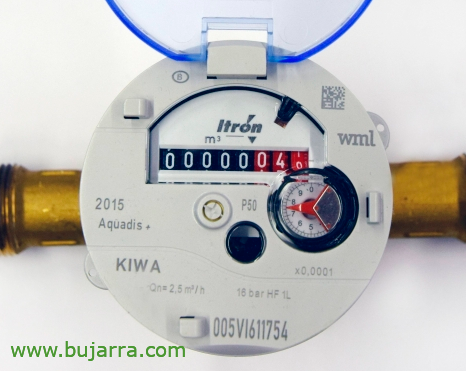 |
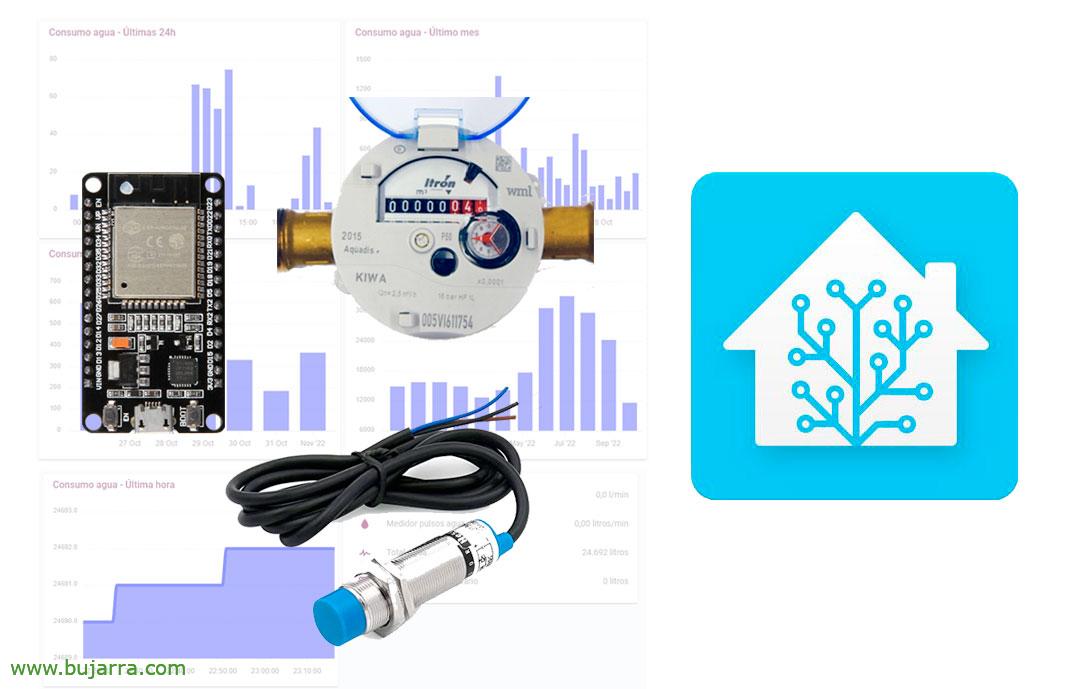
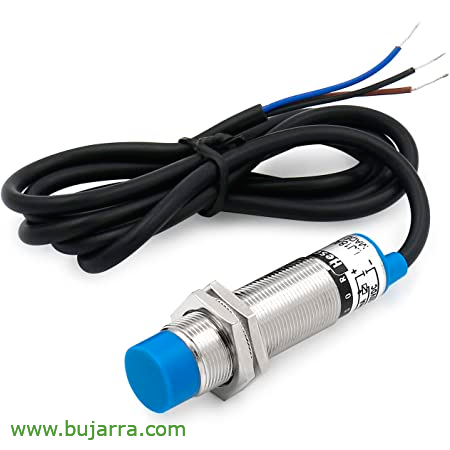
Well, total, that in the end it turns out that we have a very simple way of reading the reading of a meter, We can do this using a proximity sensor, specifically with the LJ18A3-8Z/BX NPN (for just over €10). Water meters, They usually have a small roulette wheel, This roulette wheel spins and has a small magnet that we can detect on each spin. Every turn, Each pulse equals 1 liter.
 |
 |
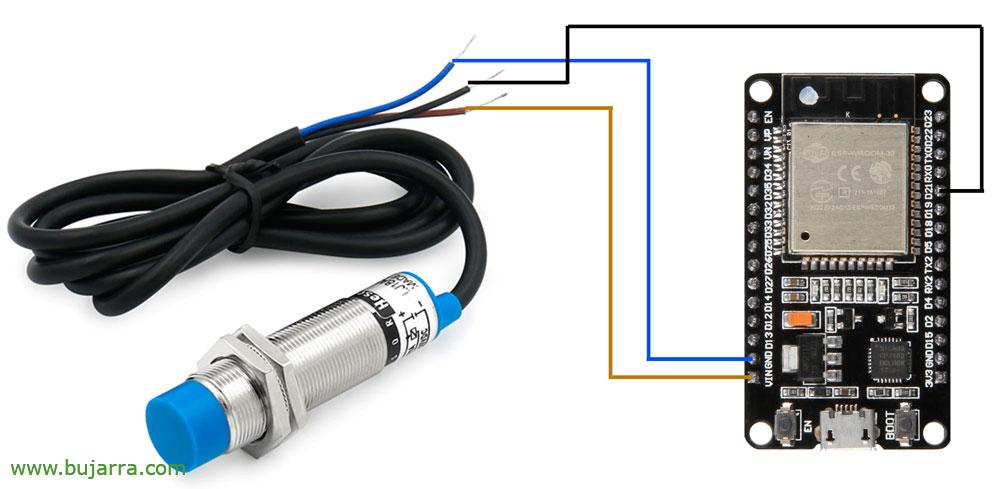
So, we will connect the LJ18A3-8Z/BX proximity sensor to our board with the ESP, be it ESP8266 or ESP32, and then we will glue the sensor to said water meter spinner. Obviously, Before you hit anything, We will test it beforehand with a magnet that we have in the fridge 😉 The wiring is very simple and would look like this, brown cable to VIM, blue to GND and black to a data GPIO, My case is D21.
If we haven't already done it, on our board we will install the ESPHome firmware to be able to easily integrate it into Home Assistant. The easiest way to install ESPHome is from the Home Assistant itself, Adding a new device (if necessary we will make a post of this How To). And once the device is created, we add the following configuration to the board:
sensor:
  - Platform: pulse_counter pin: 21
    update_interval : 6S name: "Water pulse"
    Id: pulso_agua

  - Platform: pulse_meter pin: 21
    Name: "Water pulse meter"
    unit_of_measurement: "liters/min"
    icon: "mdi:Water"
    total:
      Name: "Total Water"
      unit_of_measurement: "Litres"

  - Platform: Template Name: "Water Flow"
    Id: flujo_agua accuracy_decimals: 1
    unit_of_measurement: "l/min"
    icon: "mdi:Water"
    lambda: Return (Id(pulso_agua).state * 10);
    update_interval: 6s
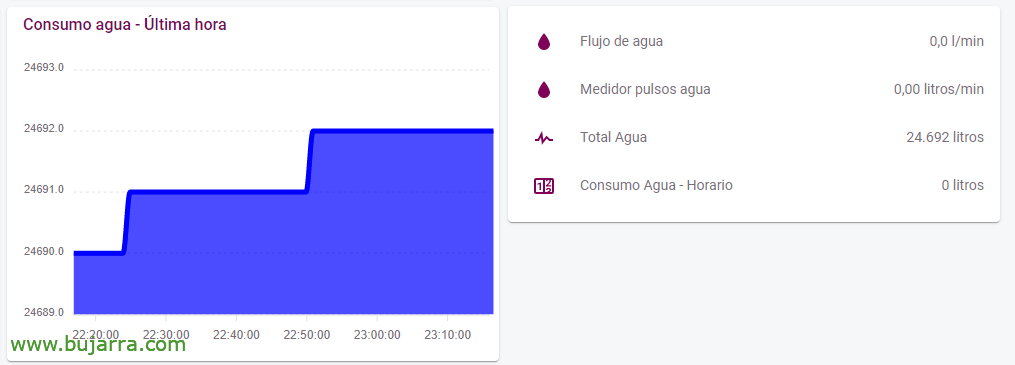
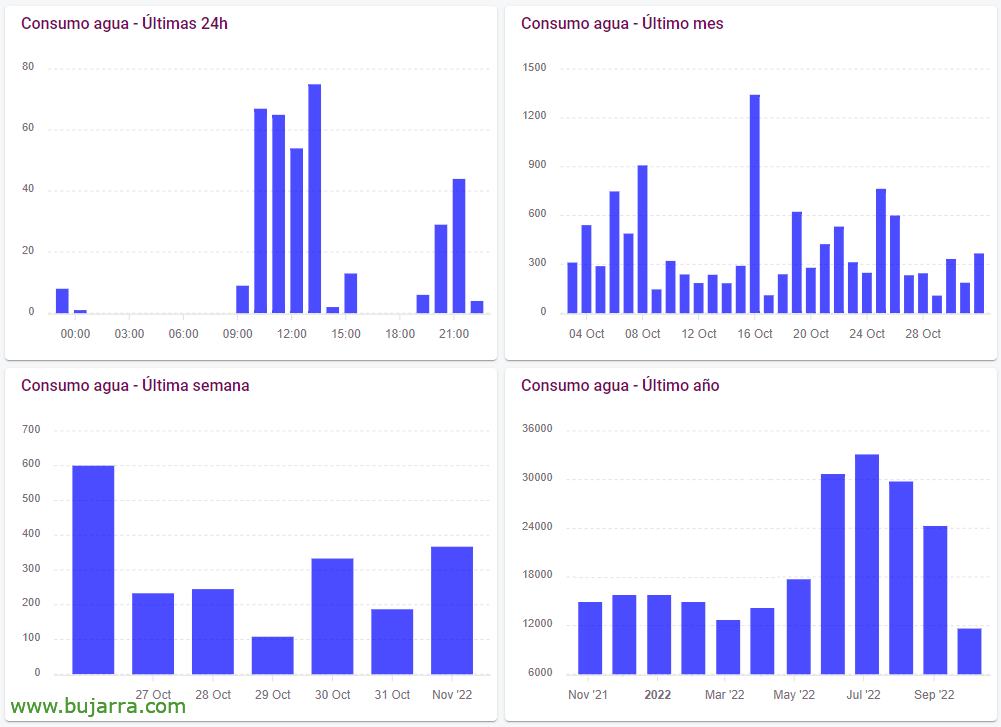
With this we will be able to know the 'Pulse of water', the 'Total Water'’ and the 'Water Flow'. It will take you a long time 2 minutes to add cards in Home Assistant, I leave you their codes in case it is of any use to you:
type: Custom:Apexcharts-Card Header:
  show: true title: Water consumption - Last minute show_states: false series:
  - entity: sensor.total_agua name: Luxes type: Area Opacity: 0.7
    colour: Blue group_by:
      Duration: 1It works for me: Avg graph_span: 1h update_interval: 5Mins
And then on Home Assistant, if we want to store the data for statistics and know the hourly water consumption, per day, monthly or annual, we should create the following Utility Meters directly in the Home Assistant configuration file (configuration.yaml):
utility_meter:
  consumo_agua_horario:
    Name: "Water consumption - Timetable"
    Source: sensor.total_agua cycle: hourly consumo_agua_diario:
    Name: "Water consumption - Daily"
    Source: sensor.total_agua cycle: Daily consumo_agua_mensual:
    Name: "Water consumption - Monthly"
    Source: sensor.total_agua cycle: monthly consumo_agua_anual:
    Name: "Water consumption - Annual"
    Source: sensor.total_agua cycle: yearly
And the cards to visualize this data, I leave you with an example:
type: Custom:Apexcharts-Card Header:
  show: true title: Water consumption - Last month show_states: false series:
  - entity: sensor.consumo_agua_diario name: Liters type: column opacity: 0.7
    colour: Blue group_by:
      Duration: 1d func: Max graph_span: 30d update_interval: 5min
I hope it is useful to you, Between now and the end of the year I intend to publish other posts that take readings not only from the water meter at home, otherwise, of electricity costs, of the gas… As usual, wishing you a great deal of success! Hugs,