Exploiting our Citrix farm with Grafana

Good, I leave you a post where we see how we can exploit the information stored by Citrix in its databases. As I imagine you know, Citrix stores in a database the records of what happens on our Citrix farm, but that is true, as much as you pay, as much as you get, that is, which depends on the Edition we have, Citrix will store information in those databases for 1 week, or 1 month or 1 year. Here we will see how to make our own panels with Grafana and without date limits!
What I said, in this post we will only see an example with the User Sessions, where we will have a history of who opened what and when, but of course we can also visualize the performance of Citrix servers, The Delivery Controller, VDAs… As well as customers, What version do they have?, What SO…
So if you know, typically Citrix stores in 3 different databases the information you show us on your Studio or Director consoles, the idea is to make a fourth database where we store what interests us, and that DB will be our historical, which will be the one that Grafana consults, and so we do not lose history and have much more information and above all personalized for us, only with what we want to see.
Before you begin, we'll need to have this fourth DB created, we can do it from SQL Server Management Studio (SSMS) with the following code:
Create Table LogCitrix.dbo.Sessions (FullName varchar(255),StartDate DATETIME,EndDate DATETIME,SessionIdleTime DATETIME,ConnectedViaIPAddress varchar(255),ConnectionID INT);
The following, We will need a .BAT file that we will execute as often as we want to store it in this database (Ours) information and then exploit it with Grafana. This BAT will normally be run with the Windows Task Scheduler. Let's call it for example LogCitrix.bat and this would be its content:
@echo off sqlcmd -S NOMBRE_SERVIDOR_DELIVERY_CONTROLLER -i C:\LogCitrixsessiones.sql -o C:\LogCitrixsessiones.txt
We will also need the . SQL that has the instructions of what content and from which tables we are going to bring, In my example, This one is called sessiones.sql, and this would be its content:
Insert Into logcitrix.dbo.sessions select U.FullName, S.Startdate, S.EndDate, S.SessionIdleTime, C.ConnectedViaIPAddress, C.id FROM [NOMBRE_BD_CITRIX_MONITORING].[MonitorData].[Session] S, [NOMBRE_BD_CITRIX_MONITORING].[MonitorData].[User] Or, [NOMBRE_BD_CITRIX_MONITORING].[MonitorData].[Connection] C Where s.userid=U.id and S.currentconnectionid=c.id;

with sessionsCTE AS
(
SELECT *, ROW_NUMBER()OVER(PARTITION BY Connectionid ORDER BY Connectionid) AS RowNumber FROM logcitrix.dbo.sessions
)
DELETE FROM sessionsCTE WHERE RowNumber > 1

This is what we will have following the previous example, Wow, what I said, this is a table for Users Sessions only, where we are going to save who connected and when, when you logged out and from where you logged in. I'm telling you, which depends on the data you want to bring in you will have to bring data from other tables, that I don't put it on now so as not to complicate your life 😉
Citrix Session History,

And nothing, with data already stored, as usual, we must create a new DataSource or Data Source against the SQL server in question and the Citrix database that we have just created, so we can ask you questions. To do the table display, Personally I like to use the panel more ‘Datatable Panel‘ by Brian Gann (You will see in the link how easy this type of Panel is to install), is that way we can make filters, Searches…
And it will be as simple as entering this query:
SELECT [FullName] AS 'NAME',
[StartDate] AS 'START TIME',

case when [SessionIdleTime] Is null then [EndDate]
when [End up] IS not null and [SessionIdleTime] IS not null then [SessionIdleTime]
end as 'END TIME',
case when [SessionIdleTime] Is null and [EndDate] IS not null then 'USER CLOSURE' when [SessionIdleTime] Is not null and [EndDate] IS not null and DATEDIFF(hour,[SessionIdleTime],[End up])≫=2 then 'DOWNTIME CLOSURE' when [SessionIdleTime] Is not null and [EndDate] IS not null and DATEDIFF(hour,[SessionIdleTime],[End up])≪2 then 'USER CLOSURE' end as 'CLOSURE TYPE',

--[SessionIdleTime],

-- [EndDate],

case when [ConnectedViaIPAddress] ='DIRECCION_IP_NETSCALER_GATEWAY' then 'FUERA OFICINA' else 'OFICINA' end as 'CONEXION DESDE'--,

-- [ConnectedViaIPAddress],
-- [ConnectionID]
FROM [LogCitrix].[Bod].[Sessions]
where [FullName] ≪≫ 'Rubén Tercero García' and [StartDate]≫'2019-09-23' order by StartDate desc
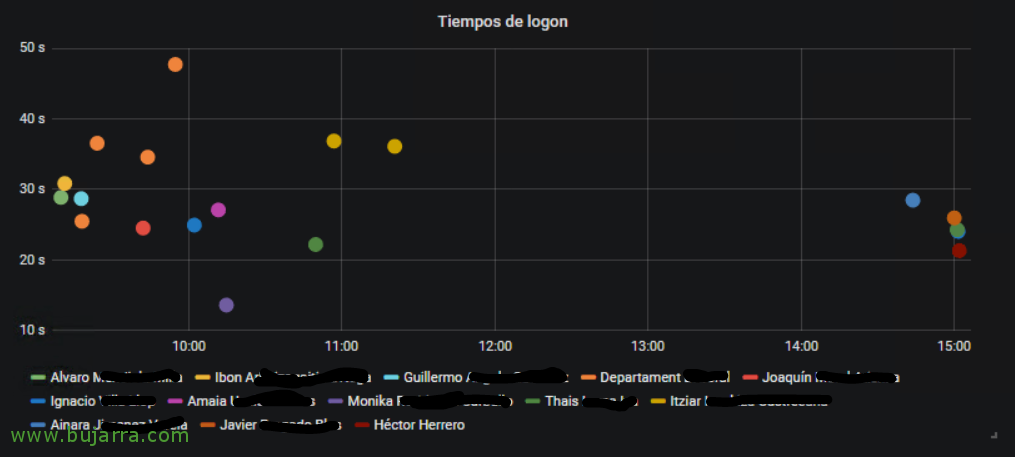
Logon Times,

Logon time in Citrix environments we know is very important, if we want, We can visualize how long it takes for users to open sessions (and when), in this case why we use UPM and not FSLogix (that the problem of roaming profiles disappears). And this instead of consulting this historical database, we can ask Citrix production databases directly, in this case to Monitoring (So remember, that this will need another DataSource created in Grafana, against the production DB). Getting ready with this Select:
SELECT $__timeEpoch(S.Startdate),
S.logonduration as value,
U.FullName as metric FROM
[NOMBRE_BD_CITRIX_MONITORING].[MonitorData].[Session] S, [NOMBRE_BD_CITRIX_MONITORING].[MonitorData].[User] U WHERE $__timeFilter(S.Startdate) and s.userid=U.id ORDER BY S.Startdate ASC
Open apps,
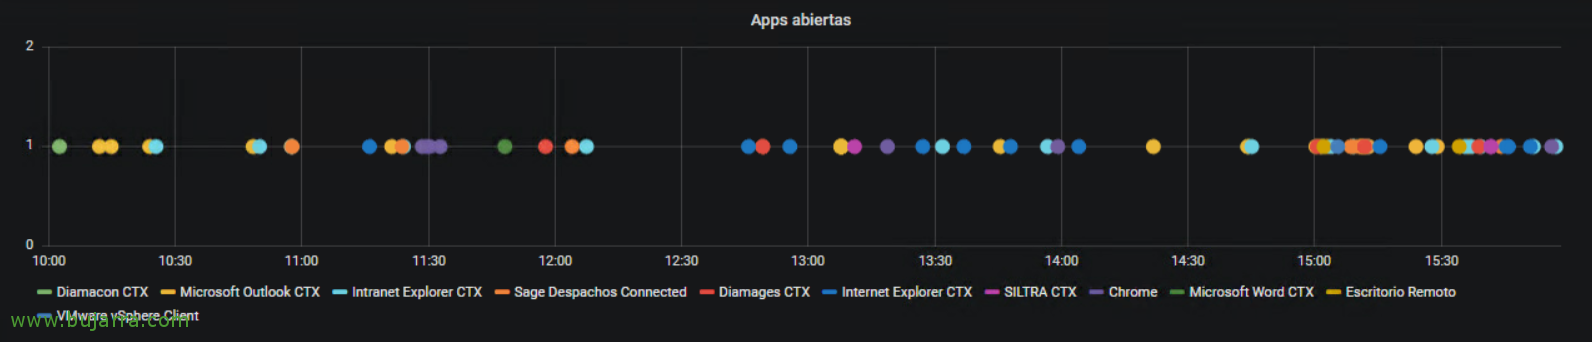
As a last example, I leave you with a table where we can see the apps that users are opening, so we have some idea of what is going on on our farm. We make a graphic panel and in this case through the following Select we would have it:
SELECT $__timeEpoch(AI. Startdate),
1 as value,
--tata as metric,
A.PublishedName as metric FROM
[NOMBRE_BD_CITRIX_MONITORING].[MonitorData].[Session] S, [NOMBRE_BD_CITRIX_MONITORING].[MonitorData].[User] Or, [NOMBRE_BD_CITRIX_MONITORING].[MonitorData].[Connection] C, [NOMBRE_BD_CITRIX_MONITORING].[MonitorData].[Application] To, [NOMBRE_BD_CITRIX_MONITORING].[MonitorData].[applicationinstance] AI WHERE $__timeFilter(S.Startdate) and s.userid=U.id and S.currentconnectionid=c.id and AI.sessionkey=S.sessionkey and A.id=AI.applicationid ORDER BY S.Startdate ASC
This post has the idea that it has is that, that you know that any database that we have in our organizations can be exploited, and visualize your data, Other examples I have is that, Quesito visualizations of which versions Citrix Receiver/Citrix Workspace users have… Or if you have an ERP, The same, exploit it and visualize Navision data, SAP… or if you have a time manager, I'm sure your bosses would love to have real-time reports with the data they care about! Remember that you can also later export this in a PDF beautiful and sent by email in a scheduled manner to the recipients we are interested in.
I hope you have been interested!