Solar panels with Home Assistant and Huawei

I wanted to share with you, In case anyone needs it, go, a compilation of the steps I followed to integrate the Huawei inverter with Home Assistant, to see any consumption or data of the inverter itself, of the battery or plates among others. Thus, from the Home Assistant app itself, we will have all our energy consumption detailed, We will have historical…
In the installation we have a Huawei SUN2000 solar inverter, a Huawei battery and some solar panels =) Huawei's own inverter has Wifi connectivity, I don't use it because I've had a bad experience with that device and my Unifi network, so to the Huawei inverter we will connect an Elfin-EW11. This device provides Wifi connectivity to an RS485 serial interface, so we can make Home Assistant connect via Wifi to this device to read the inverter's data.
EW11 Configuration
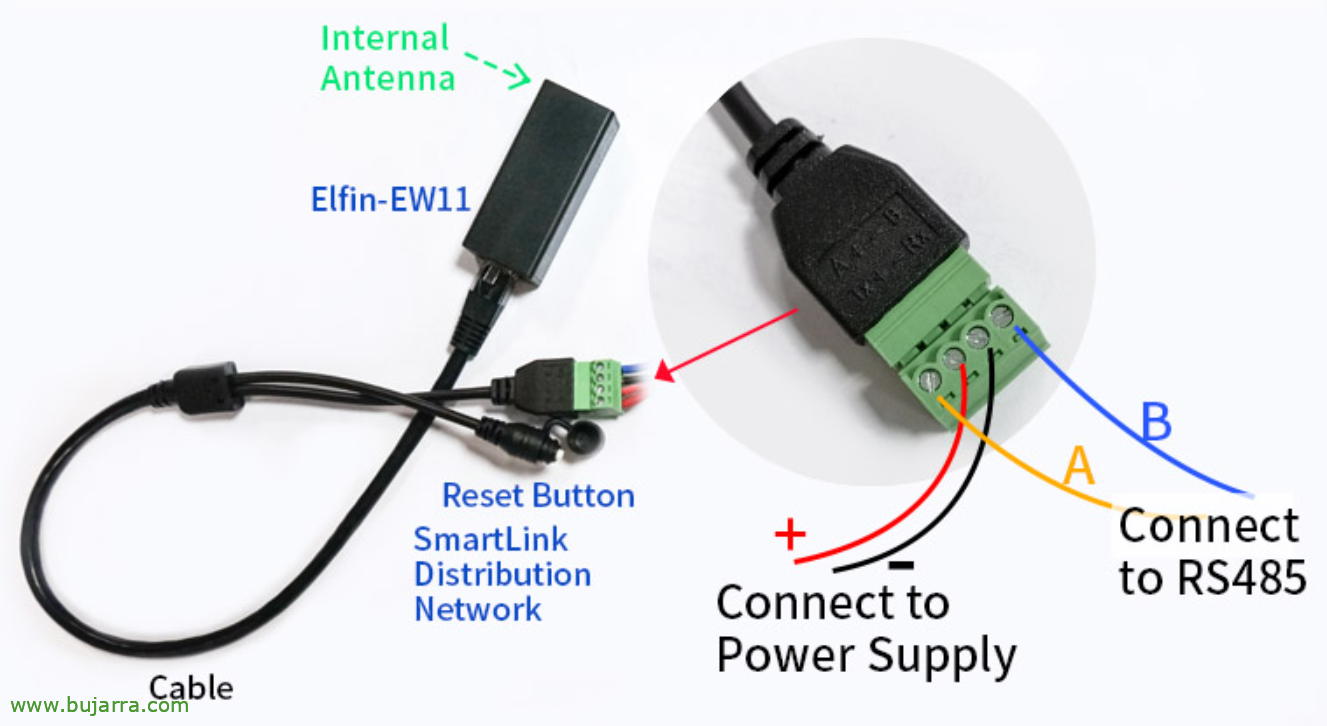
We will connect the Huawei inverter to Home Assistant via Modbus RTU, we use Elfin EW11 or EW11A adapter, which as we have mentioned is a Modbus RTU to Wifi converter. It comes with a cable that has a reset button on one side that can come in handy to reset the connection, and on the other hand a green connector with 4 Tickets. The wiring of the green connector, It comes marked and looks good:
- In the 2 Center Pins Go Power, positive ( + ) and negative ( – ) of a charger (input 5-18VDC and I think I remember 1A).
- On the sides is connected the A and B that come from the Huawei connector. In my case, the number 1 Huawei connector to EW11 B, and the number 2 Huawei connector to EW11 A.
How perhaps in a written post it is difficult to see this type of connection, I recommend a couple of videos of A Madman and his technology where he explains this topic perfectly (one and two).

We connect the transformer to the power and the Elfin EW11 will turn on, a Wifi called EW11_XXXX will appear, we connect to it.

Open the browser against the http IP address://10.10.100.254 With admin username and default admin password.

Let's go to the menu of “System Settings” > Seek “Wifi Settings” and in 'Wifi Mode’ AP we put it to STA to connect to our Wifi, we indicate our SSID and password. We give “Submit”,
We finally connect the connection that comes from the Huawei connector to the EW11, Go Putting Together Green Connectors.

We connect to the EW11 management website and we are going to “Serial Port Settings”. In “Basic Settings” we will take into account that the 'Baud Rate’ will be at 9600, the 'Data Bit’ a 8, the 'Stop Bit'’ a 1 and the 'Parity'’ to None. And finally in “Protocol Settings” we will change the Protocol to 'Modbus'. We give “Submit”.

In the “Communication Settings”, in “Socket Settings” we will indicate the 'Local Port’ a 502, The 'Buffer Size'’ a 1024. We give “Submit”.
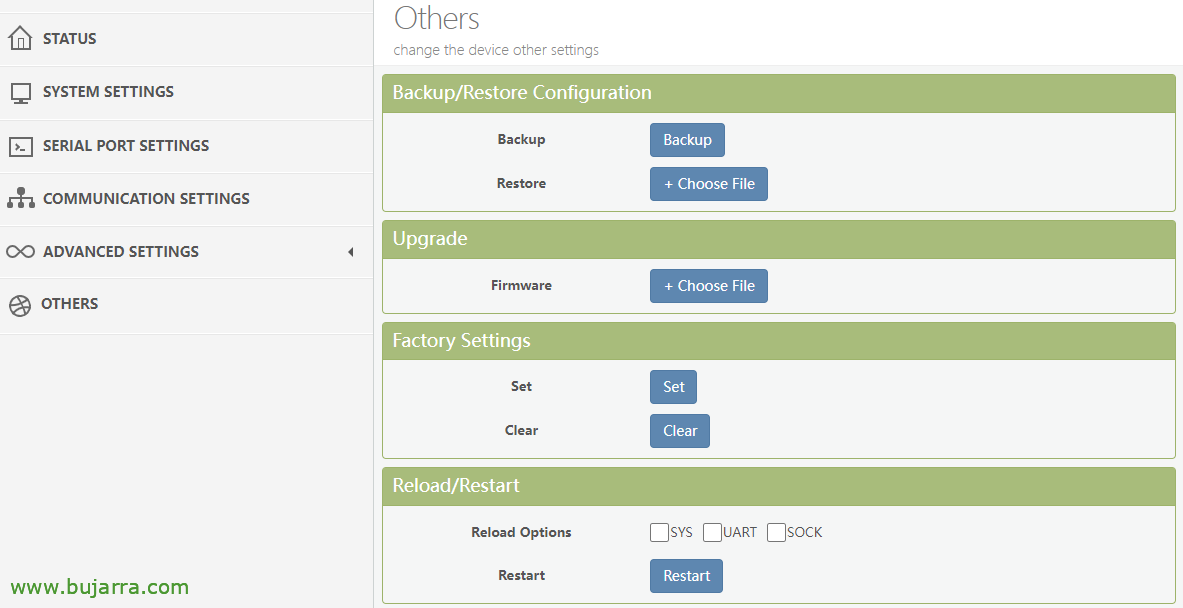
Let's go to the menu “Others” and restart the device from “Restart”.
Now we have the EW11 device ready, on our Wi-Fi network and allowing connections for data consultation, from now on we will be able to connect with Node-RED for example and manually read the data, or use an integration that does it all for us.
Huawei Solar Configuration
At the time I unfolded this, Huawei Solar was installed from HACS, in HACS we must find and install the Huawei Solar integration and restart Home Assistant. If you need help installing this integration, check out Your documentation And you'll have it, but hey, it's adding a repository and installing the integration with 1 Click.
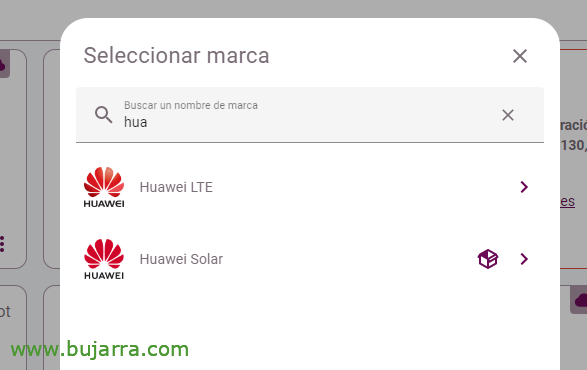
Once the integration is installed, we can add it to our Home Assistant, To do this, we are going to “Settings” > “Devices & Services” > “Add Integration” and we look for Huawei Solar and we click on it.

It will ask us for the connection, in our case 'Network',

We indicate the IP address of the EW11, the port we have indicated and in Slave IDs a 1. “Send”,

And it will tell us that it has correctly detected and added the Inverter devices, Battery and Energy Meter. “Finish”,

Let's go to your System Options, to enable the poll, to refresh sensors more frequently,
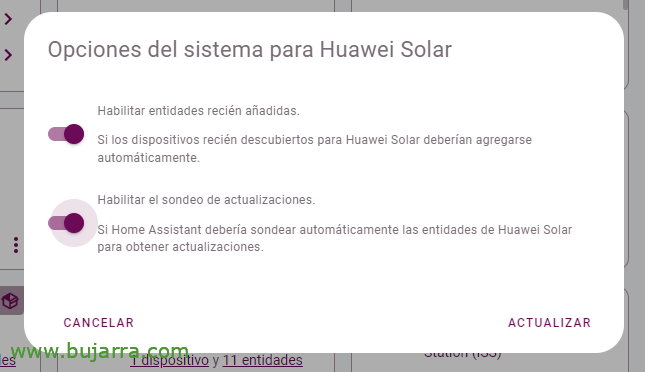
And we update,

He will have created these entities for us that we can group together in an ugly way, But to get an idea of how much data we will be able to obtain from each device.
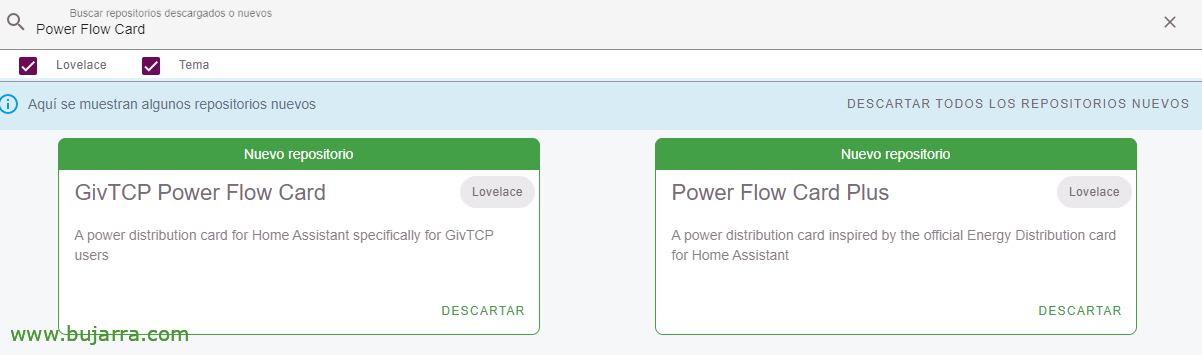
We can download a card called 'Power Flow Card Plus' at HACS’ to see this data in a more intuitive way. Let's go to HACS > Interface > Seek: Power Flow Card Plus and we download it.

And we would have, for example, those two cards with real-time consumption, and the newspaper, For example. I will leave you below the YAML code, pero ya no es necesario y se configura con el ratón en un periquete.
type: Custom:power-flow-card-plus title: Electricity consumption - Tiempo real entities:
  Battery:
    entity: sensor.battery_charge_discharge_power     state_of_charge: sensor.battery_state_of_capacity     invert_state: true   grid:
    entity: sensor.pzem_004t_v3_power     invert_state: true   solar:
    entity: sensor.inverter_input_power     display_zero_state: true   individual: []
  fossil_fuel_percentage: {}
  Home: {}
clickable_entities: true display_zero_lines:
  mode: show   transparency: 50
  grey_color:
    - 189
    - 189
    - 189
use_new_flow_rate_model: true w_decimals: 1
kw_decimals: 1
min_flow_rate: 0.75
max_flow_rate: 6
max_expected_power: 2000
min_expected_power: 0.01
watt_threshold: 1000
inverted_entities: Battery, grid
Ejemplo de ver en modo grid en tiempo real, en YAML, cambiando tus dispositivos, o en modo GUI mejor, go.
type: Custom:apexcharts-card graph_span: 12h header:
  show: false   title: Home Consumption - 24h   show_states: false yaxis:
  - Id: first     decimals: 0
  - Id: second     opposite: true     decimals: 0
Series:
  - entity: sensor.inverter_input_power name: Output of FV type: Area Opacity: 0.7
    stroke_width: 1
    colour: orange yaxis_id: first group_by:
      func: AVG Duration: 1min show:
      in_header: False legend_value: False
  - entity: sensor.battery_charge_discharge_power name: Battery type: Area Opacity: 0.5
    stroke_width: 1
    colour: yaxis_id Network: first group_by:
      func: AVG Duration: 1min
  - entity: sensor.battery_state_of_capacity name: Battery charging type: Line opacity: 0.5
    stroke_width: 2
    colour: Black yaxis_id: Second group_by:
      func: AVG Duration: 1min
  - entity: sensor.inverter_active_power name: ActivePower type: Area Opacity: 0.5
    stroke_width: 1
    colour: Green yaxis_id: first group_by:
      func: AVG Duration: 1min
  - entity: sensor.pzem_004t_v3_power name: Iberdrola Type: Area Opacity: 0.5
    stroke_width: 1
    colour: pink yaxis_id: first group_by:
      Duration: 1It works for me: Avg
Or if you need the ApexChats card code as an example to see the evolution of uses and consumption.
And to conclude, I recommend an integration called “Forecast.Solar” that will allow you to know the solar forecast of the day, the next hour or the next day, For informational mode or use in automations =)
I hope you find it interesting,