Monitoring a Fortigate Firewall from Centreon

In this post we will see how to monitor our Fortigate firewalls from a Centreon or Nagios or whatever we have 🙂. We will do it through SNMP queries and we will be able to know the status of its chassis at all times, the status of the cluster if we have one, the use and consumption of network interfaces, if we have VPNs the same, know if they fall, The sessions, etc, etc… if you have a Fortigate, This is your post!
Enabling SNMP in Fortigate,

Before we start monitoring, we must enable SNMP in the Fortigate firewall, we log them on the administration website and from the menu “System” > “SNMP”, we must enable the 'SNMP Agent’ and in this case I will enable SNMP v2c, We do this by clicking on “Create New”.

We indicate the name of the community, the IP to which it will allow queries (Our Monitoring Machine) and we indicate that it only allows consultations with 'Accept queries only'. “OK”,

Please note that you must indicate the Fortigate network interface through which you will be asked, for this, since “Network” > “Interfaces”, select the network where our Centreon or Nagios machine is located, In my case, the LAN leg, and tick the SNMP tick in 'Administrative Access'. “OK”,
Installing the Fortigate Monitoring Plugin,
GOOD, on our Centreon machine, We must download the script that we are going to use to monitor these gadgets, Use check_fortigate.pl, A piece of script from Oliver Skibbe that will allow us to monitor not only Fortigate devices, but the FortiMail or FortiAnalyzer if we also have them. If we execute the following we will install the requirements, We'll download the script, We make it executable, We'll leave it where it belongs 🙂, create a necessary directory, and change its permissions:
[SourceCode]cpan -i List::Compare
wget https://raw.githubusercontent.com/riskersen/Monitoring/master/fortigate/check_fortigate.pl
chmod +x check_fortigate.pl
MV check_fortigate.pl /usr/lib/centreon/plugins/
mkdir -p /var/spool/nagios/ramdisk/FortiSerial
Chown centreon-engine:centreon-engine /var/spool/nagios/ramdisk/FortiSerial/ -R[/SourceCode]
You can try running check_fortigate.pl -h to see all the possibilities that the script gives you, Here we will see some of the most interesting!
Already in Centreon, create the Commands,
Let's create the 2 Commands we'll need to be able to get the metric values, one of them will have Warning and Critical values in case we want to customize the values when creating the Services.

What I said, since “Configuration” > “Commands” Create 2 Commands:
- Command Name: check_fortigate.pl_wc
- Command Type: $CENTREONPLUGINS$/check_fortigate.pl -H $HOSTADDRESS$ -C $_HOSTSNMPCOMMUNITY$ -T $ARG 1$ -w $ARG 2$ -c $ARG 3$
- Arguments: Create 3 Arguments, Click on “Describe arguments” and we discharge them: ARG1 : Guy, ARG2 : Warning and ARG3 : Critical.
- Command Name: check_fortigate.pl
- Command Type: $CENTREONPLUGINS$/check_fortigate.pl -H $HOSTADDRESS$ -C $_HOSTSNMPCOMMUNITY$ -T $ARG 1$
- Arguments: Create 1 argument, Click on “Describe arguments” and we discharge you: ARG1 : Guy
Create the Host,

We will simply have to register our Fortigate firewall in our Centreon, No? To do this, we will create the Host from “Configuration” > “Hosts”. If we have a firewall cluster, what is monitored at all times is the active FW, and not the passive; therefore, we register the IP of our cluster and then we will see how to monitor the slave firewalls. We indicate as always its name, your IP address, SNMP community and version. We associate it with our administrative staff and that's it!
Creating the Services,
Now we have to create as many Services as we want to monitor (What if the CPU, memory…), I leave you very briefly a summary of the Services that I am using, with the Command they are associated with and the arguments they need.
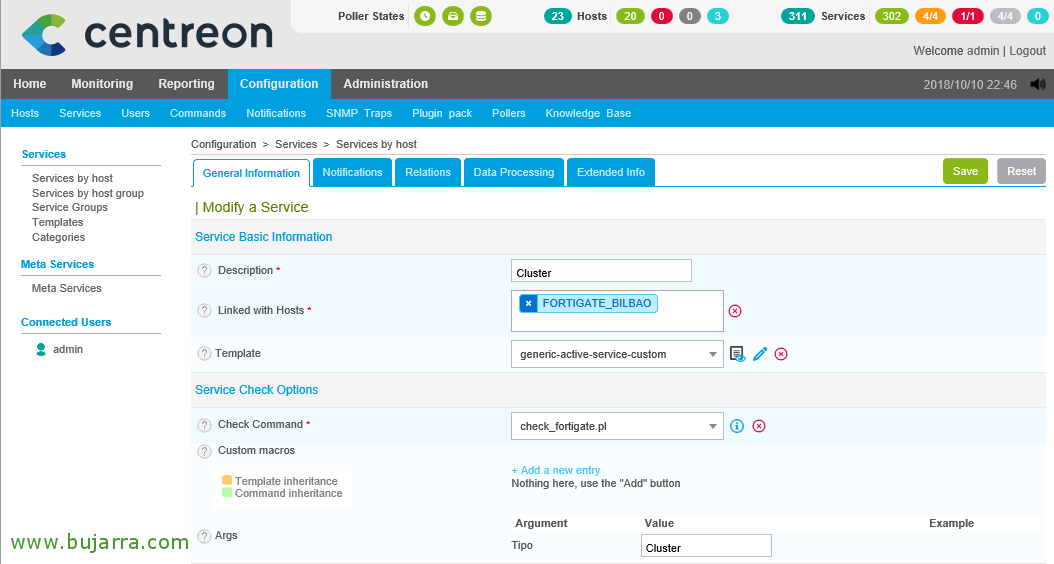
To know the status of the cluster's health, we will create this service:
- Description: Cluster
- Check Command: check_fortigate.pl
- Argument: Cluster

To find out your CPU usage, We created this service:
- Description: CPU
- Check Command: check_fortigate.pl_wc
- Arguments: CPU, 80, 90.

To know the memory of RAM memory, We created this service:
- Description: MEM
- Check Command: check_fortigate.pl_wc
- Arguments: CPU, 80, 90.
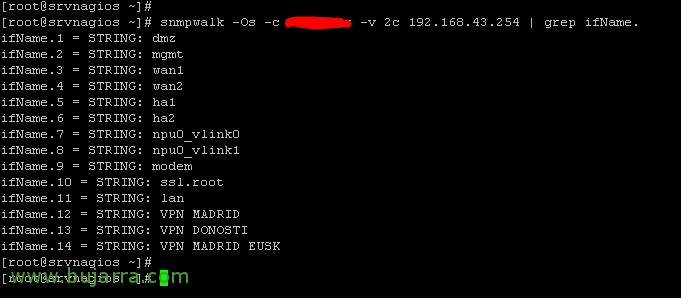
GOOD, if we want to monitor the consumption of any interface, are physical such as WAN1 or WAN2, The DMZ, MANAGEMENT mouth or HA interfaces, VLANs or VPNs, we will be able to know beforehand which interface ID will correspond to which network, for this, simply from the shell of the Centreon we execute:
[SourceCode]snmpwalk -Os -c COMUNIDAD_SNMP -v 2c DIRECCION_IP_FORTIGATE | grep ifName.[/SourceCode]

And that's it, we create as many Services as interfaces we want to monitor, for example the WAN1 of my forti which is a fiber line that goes to 600Mb:
- Description: WAN1 Interface
- Check Command: check_centreon_snmp_traffic_id
- Arguments: 3, 80, 90, 2, 300.
Note, this Command if you don't have it, We saw it in a Previous Post, when we monitored the network interfaces of a Windows, Linux…

To know the status of VPN connections, we can look at it individually if we are interested, by VPN Type, whether they are IPSEC or SSL… but in this example I show it globally, Have 3 VPNs raised and let me know if one goes down, that's enough, No?
- Description: VPNs
- Check Command: check_fortigate.pl
- Arguments: VPN

If we want to know the active sessions that the firewall has, then this is the same thing.… But watch out! Now I'm telling you a trick, If you want to know the metrics of the other firewall, go, of the passive, You know that by putting in a '-s’ In the end you will get it, the cute thing is to have made a Command for it, But if you're interested in what I've said, to know the slave's CPU or whatever, You do as in the image above.
- Description: Sessions
- Check Command: check_fortigate.pl_wc
- Arguments: Ses, 2000, 3000.
Result!
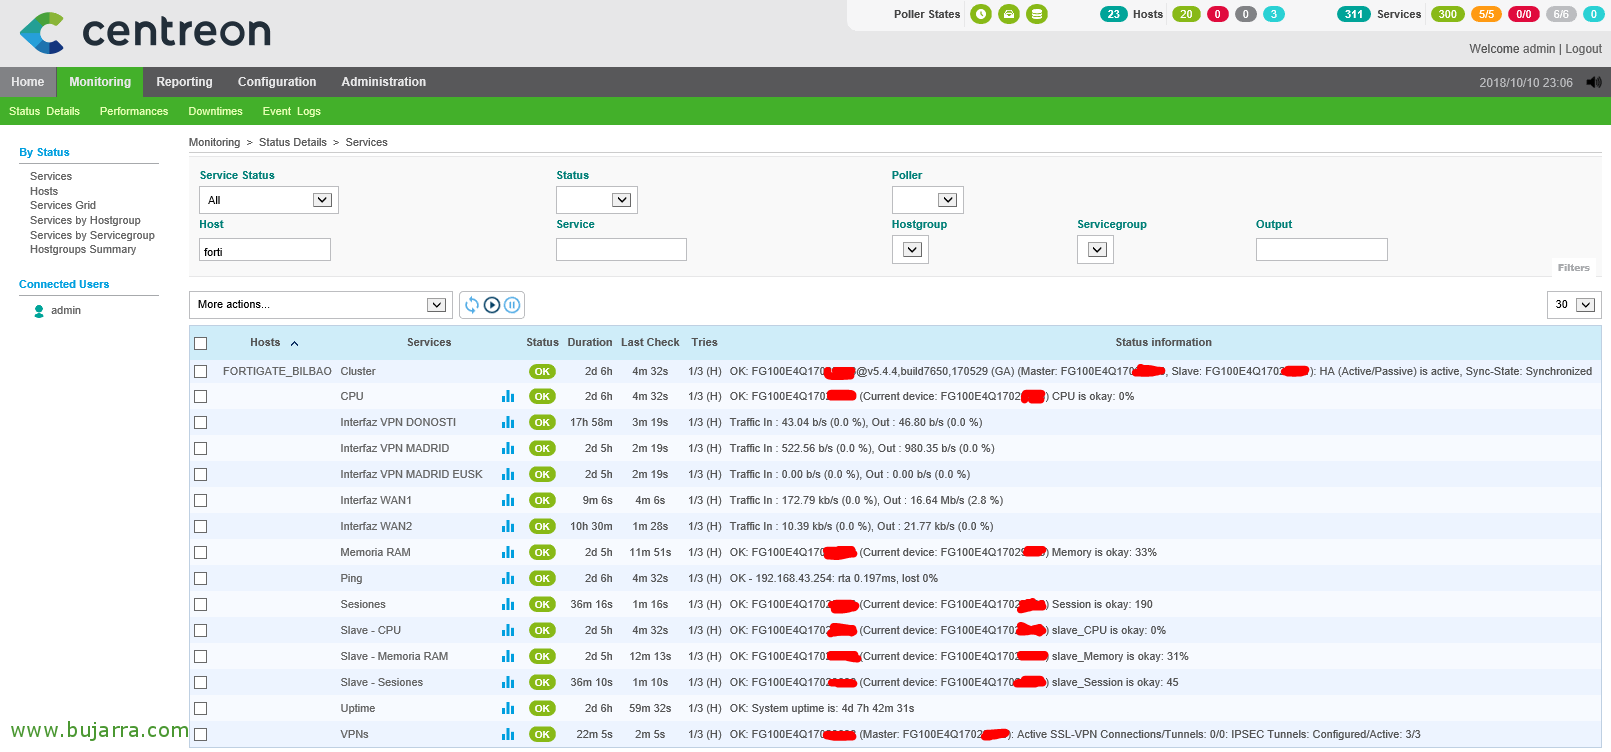
Badaboom! Here we have the result of what we would be monitoring, Once all services have been created and the configuration has been saved, We will see the result! A marvel! We already have the fortis monitored! I hope you liked it 🙂