Viewing Meerkat Records in Grafana or Kibana

After watching How We Install Meerkat and have left it functional, Now it's time to treat your data and visualize it in a friendlier way, for this we will rely on Grafana as a visualizer, although with Kibana you can do it in the same way (or simpler). All this thanks to the fact that we will store the Meerkat LOGs in Elasticsearch.
The process is really simple, on the machine running Suricata we will install Filebeat to collect the log file and send it to Elasticsearch directly, After that, we will enable the meerkat module and configure it. Once we have it ready, should our Elasticsearch start storing these logs, and with Grafana to be able to exploit them, or with Kibana, go.
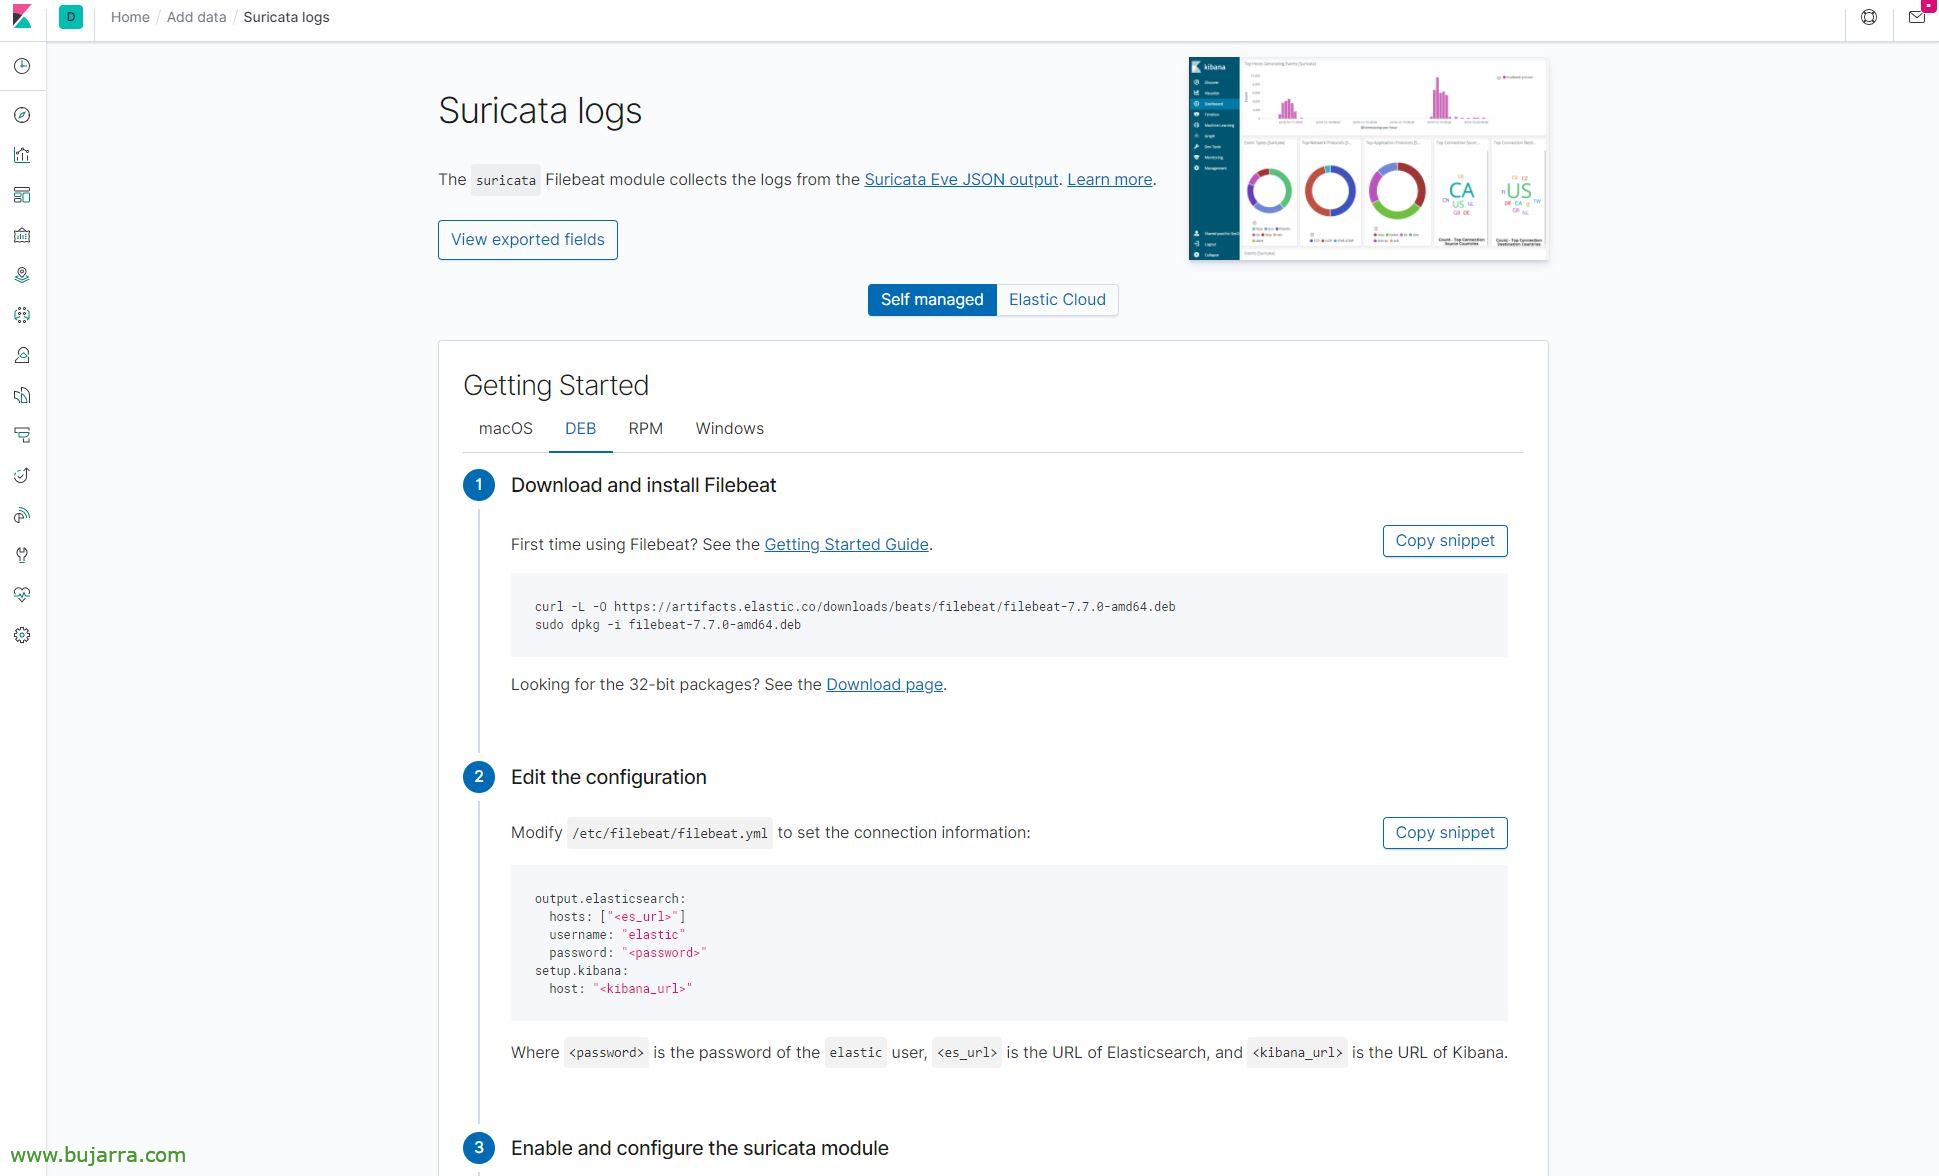
We open our Kibana, In the left menu we go to the “ALWAYS” > “Add data with Beats” > “Meerkata logs” and it will give us all the detail of what we need. This URL is: HTTP://IP_ELASTIC_SEARCH:5601/app/kibana#/home/tutorial/smericaLogs
We position ourselves on the “DEB” (in my case, since Meerkata runs under Debian Buster) and as we can see it is perfectly explained.
Installing Filebeats:
curl -L -O https://artifacts.elastic.co/downloads/beats/filebeat/filebeat-7.7.0-amd64.deb dpkg -i filebeat-7.7.0-amd64.deb
Edit the Filebeat configuration file (/etc/filebeat/filebeat.yml), we will indicate the name of the index to use in Elasticsearch, as well as if we have Kibana and we want to import the default dashboards:
#================ Elasticsearch template setting ====================
...
setup.template.name: "meerkat"
setup.template.pattern: "meerkat-*"
setup.dashboards.index: "meerkat-*"
setup.ilm.enabled: False
...
setup.kibana:
  host: "FQDN_O_DIRECCION_IP_KIBANA:5601"
...
#---------------------- Elasticsearch output ------------------------
output.elasticsearch:
  # Array of hosts to connect to.
  Hosts: ["FQDN_O_DIRECCION_IP_ELASTICSEARCH:9200"]
  index: "meerkat-%{+yyyy. MM.dd}"
...
We enable the Meerkat module, we created some predeternubadis dashboards in Kibana de Meerkata, we boot the Filebeat daemon and make it start automatically with the system.
filebeat modules enable meerkat filebeat setup systemctl start filebeat systemctl enable filebeat.service systemctl status filebeat

And without doing anything else we can go to Kibana's Dashboards or its visualizations and see the data that it collects from us.

If we want to visualize it in Grafana, as always, we must create a Data Source pointing to the Meerkat index of our Elasticsearch and we will be able to make the graphs as we see fit, with simple queries as we would do from the Discover of our Kibana, Imagination to power!

And nothing, to the 5 In the minutes you will be able to make Dashboards that are so simple and that allow you to quickly visualize what is happening, which computers access which, View Connections, etc…