
Dashboards with Crowdsec: Metabase or Prometheus with Grafana

In this post we will look at two options to keep track of our Crowdsec infrastructure, We will have two options, A little simple, A ready-made Docker container. Or, Why not, enjoy life and integrate it into Prometheus and visualize it with Grafana!
If we want to know the status of our machines with Crowdsec, the best thing is to do it through GUI and have some dashboards already made by the community help us, As I said, We have two options, a use a Docker container with Metabase already preconfigured to connect against the local LAPI, something simple and basic that can be useful. Or we can send a Prometheus metrics from our agents and then visualize it in Grafana, to taste.
Metabase,
We'll need Docker, if we do not have it previously installed:
sudo apt install docker.io -y
Y ejecutando ‘sudo cscli dashboard setup –listen 0.0.0.0’ lo desplegaremos:
sudo cscli dashboard setup --listen 0.0.0.0
    ? Metabase requires 1-2GB of RAM, your system is below this requirement continue ? Yes
    ? For metabase docker to be able to access SQLite file we need to add a new group called 'crowdsec' to the system, is it ok for you ? (Y/n) Y     INFO[12-11-2022 05:09:02 PM] Pulling docker image metabase/metabase:v0.41.5
    .............................................................................................................................................
    INFO[12-11-2022 05:09:32 PM] creating container 'crowdsec-metabase'     INFO[12-11-2022 05:09:38 PM] waiting for metabase to be up (can take up to a minute)
    ..............................
    INFO[12-11-2022 05:11:50 PM] Metabase is ready         URL       : 'http://0.0.0.0:3000'         username  : 'cr******@******ec.net'         password  : 'xxxxxxxxxxxxxxxx'
Cuando arranque el contenedor de Metabase, ya podremos abrir un navegador a http://DIRECCION_IP:3000

Este sería el Home, where we directly see the connection to Crowdsec, and 3 Panels, with the list of active decisions, a history of alerts or a general dashboard.
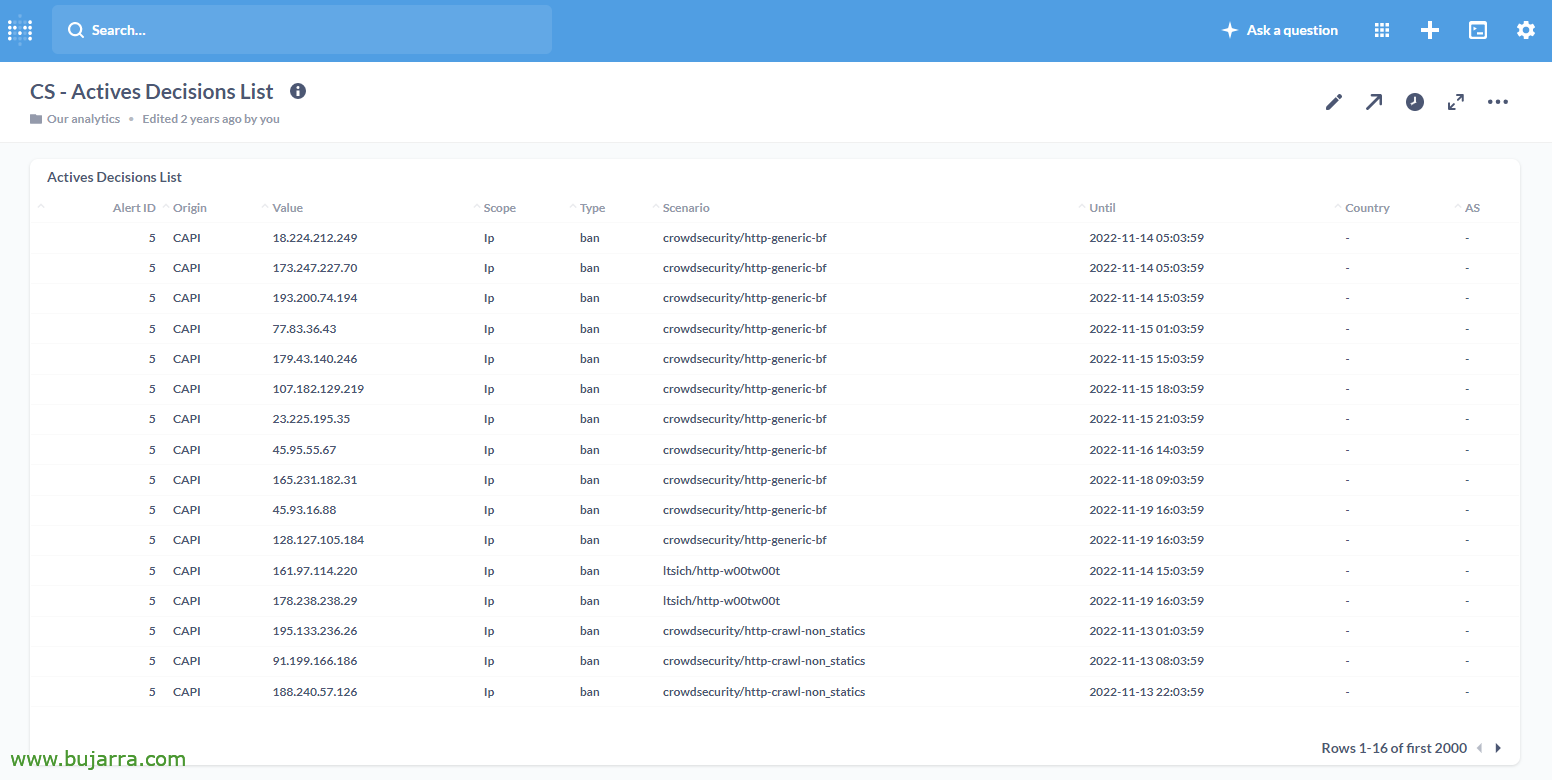
Dashboard de CS – Actives Decisions List,

Dashboard de CS – Alert History,

Dashboard de CS – Main Dashboard.
Then we can stop the Dashboard, Tear it off or delete it:
Sudo CSCli Dashboard Stop sudo CSCLI Dashboard Start sudo CSCLI Dashboard Remove --Force
Prometheus + Grafana,
In each Crowdsec agent, in your configuration file '/etc/crowdsec/config.yaml', we will need to enable Prometheus, We will indicate a listening port through which we will offer the metrics, Something like this:
Prometheus:
  enabled: true level: Full listen_addr: 0.0.0.0
  listen_port: 6060
And we reload Crowdsec to apply the above changes:
sudo systemctl restart crowdsec
To prove that this works, We can throw a curl at that port, from the machine itself or a remote one, From Shell we run 'curl http://DIRECCION_IP:6060/Metrics’ to validate:
Curl HTTP://192.168.x.xxx:6060/Metrics
    # HELP cs_active_decisions Number of active decisions.
    # TYPE cs_active_decisions gauge cs_active_decisions{action="Ban",origin="ICSC",reason="crowdsecurity/CVE-2022-xxxxx"} 16
    cs_active_decisions{action="Ban",origin="ICSC",reason="crowdsecurity/CVE-2022-xxxxx"} 2
    cs_active_decisions{action="Ban",origin="ICSC",reason="crowdsecurity/CVE-2022-xxxxx"} 2
    cs_active_decisions{action="Ban",origin="ICSC",reason="crowdsecurity/CVE-2022-xxxxx"} 669
    cs_active_decisions{action="Ban",origin="ICSC",reason="crowdsecurity/apache_log4j2_cve-xxxxx"} 11
    cs_active_decisions{action="Ban",origin="ICSC",reason="crowdsecurity/fortinet-cve-xxxxx"} 237
    cs_active_decisions{action="Ban",origin="ICSC",reason="crowdsecurity/grafana-cve-xxxxx"} 27
    cs_active_decisions{action="Ban",origin="ICSC",reason="crowdsecurity/http-backdoors-attempts"} 101
    cs_active_decisions{action="Ban",origin="ICSC",reason="crowdsecurity/http-bad-user-agent"} 3632
...
Now on our Prometheus server we will be able to add the metrics of each Crowdsec agent, In its configuration file we indicate '/usr/local/bin/prometheus/prometheus.yml’
...
scrape_configs:
...
  - job_name: 'crowdsec_OS-GRA-04'     static_configs:
    - Targets: ['192.168.x.xxx:6060']
      labels:
        machine: 'OS-GRA-04'

  - job_name: 'crowdsec_OS-JITSI-05'     static_configs:
    - Targets: ['192.168.x.xxx:6060']
      labels:
        machine: 'OS-JITSI-05'
...
And we would restart Prometheus so that it can already read the data from our Crowdsec!
sudo service prometheus restart
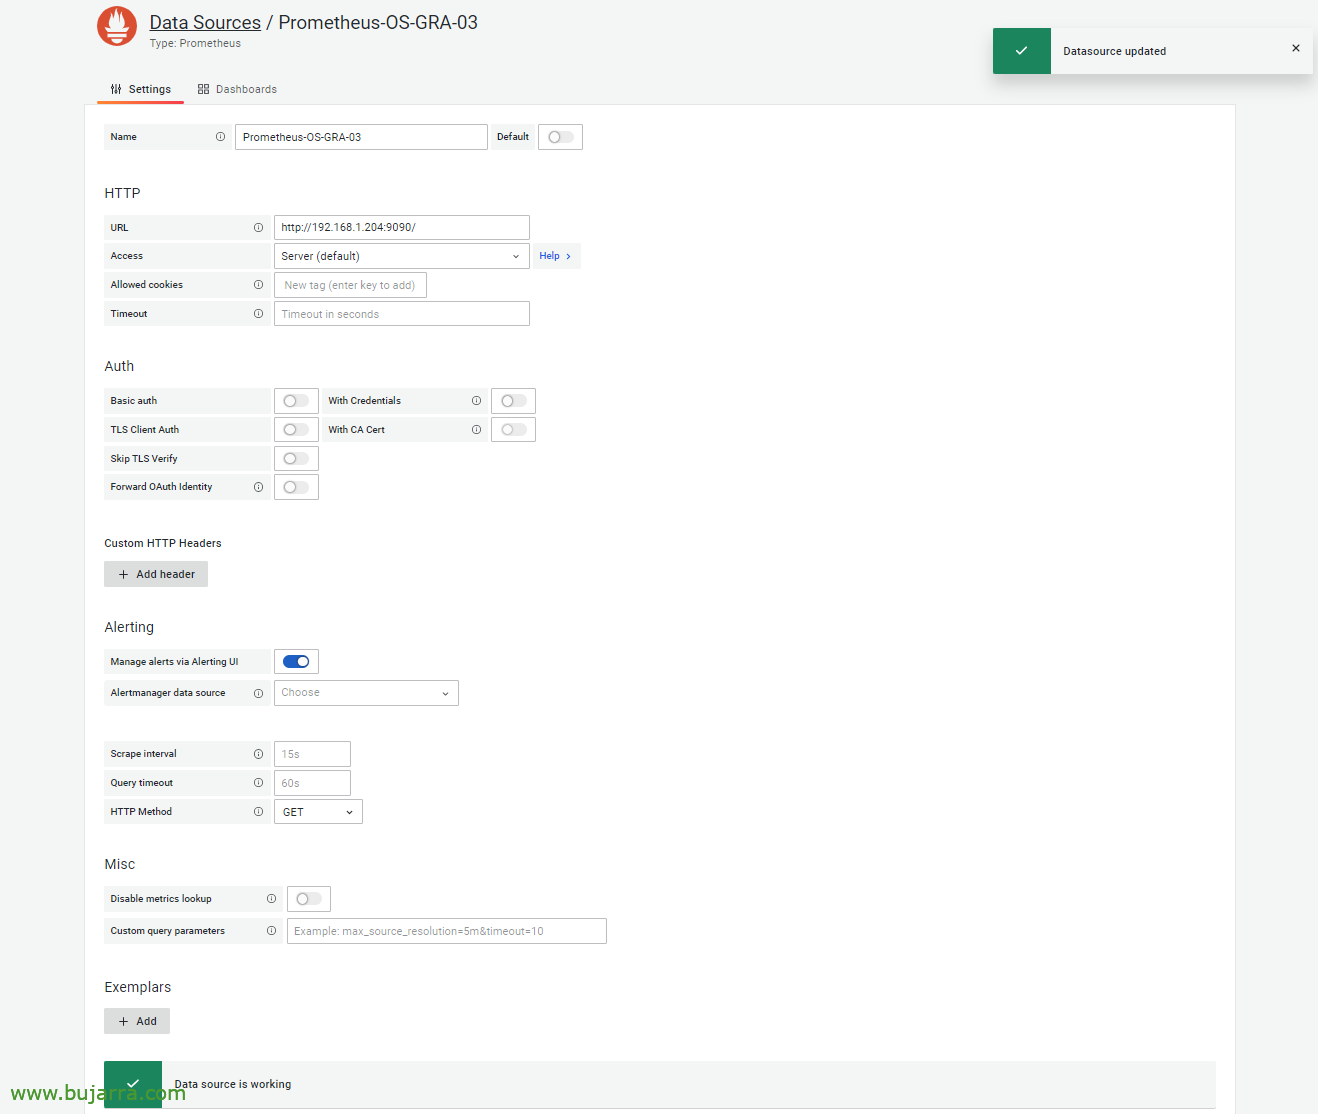
If we don't have the connector against the Prometheus from Grafana, We do it, we create the Data Source.
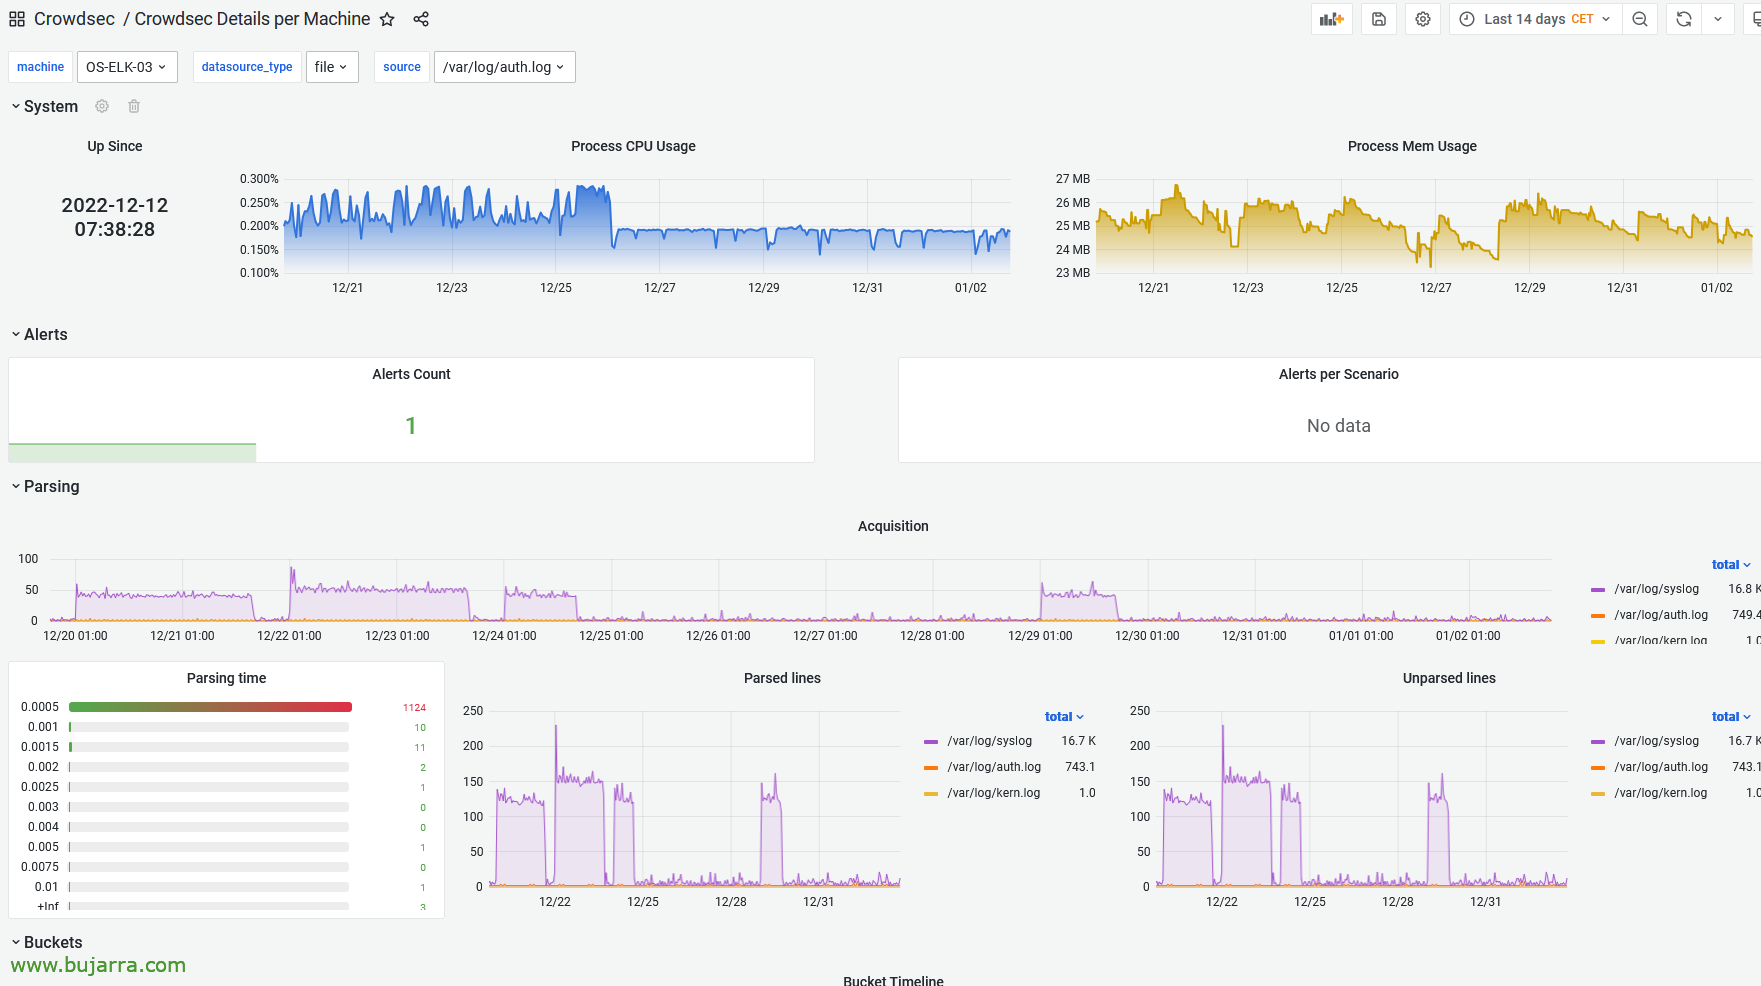
We will be able to download from https://github.com/crowdsecurity/grafana-dashboards Pre-configured dashboards, so we simply download the JSON file and import it into Grafana. This would be the dashboard with the details per agent or 'Crowdsec Details per Machine'.
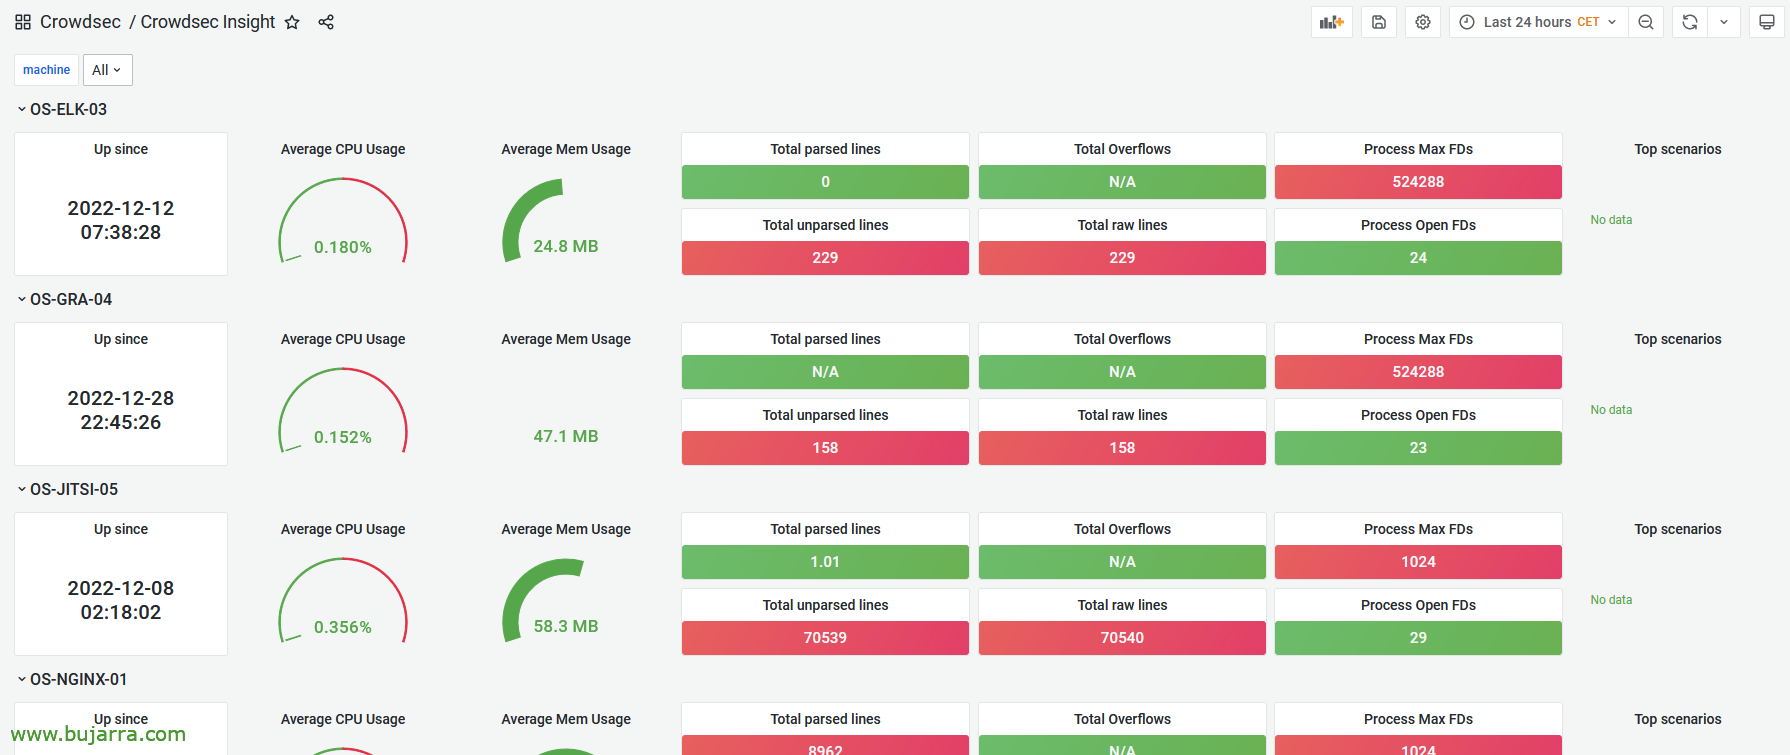
Dashboard de Crowdsec Insight, A brief glance.

And this last 'Crowdsec Overview’ By way of summary,
Well, Well, I hope you have found it interesting or at least curious the simple way to know the status of our machines with Crowdsec.
A hug!