
Enabling HTTPS in Grafana

This post is aimed at encouraging you all to use safe services whenever we can, and Grafana by default is served through the 3000 but the traffic is HTTP, therefore, Not sure; and certain data such as credentials or queries may be better protected. So that's what this is about today!
Well, what I said, Today the post will be quick, That's what it's about, to put a secure layer on it and not use HTTP in Grafana but HTTPS. So that, Please always use safe services, Then come the scares, even if they are internal services. Come, to the subject, we will first need to determine the FQDN that you will have, register this name in the DNS and how not, a certificate.
So we copied the certificate to the Grafana machine, if you have a PFX you have to separate it into two files, one with the public key and one with the private key. A good directory to leave them in can be '/etc/ssl/certs/'. By the way, depends on the AC you use, We may have to put the entire chain of intermediate or root certificates in the CRT or CER file.
OpenSSL PKCS12 -in certificate.pfx -clcerts -nokeys -out mi_certificado.cer openSSL PKCS12 -in certificate.pfx -nocerts -nodes -out mi_certificado.key
And nothing, We simply edit the configuration file '/etc/grafana/grafana.ini’ indicating that we will use HTTPS and the certificate that will secure the connection:
[Server]
protocol = https cert_file = /etc/ssl/certs/mi_certificado.cer cert_key = /etc/ssl/certs/mi_certificado.key
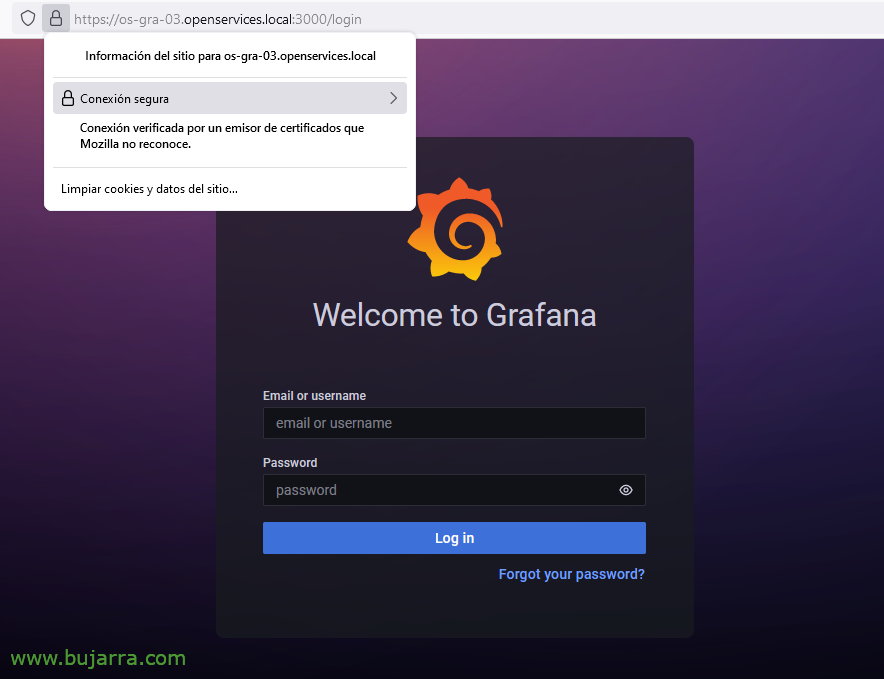
We restart Grafana and that's it! We will now be able to access Grafana via HTTPS using the default port 3000.
sudo systemctl restart grafana-server
Nothing, As I said, Short post with good practices and recommendations, May it go very well, Be happy, Take care of yourselves!