Monitoring latencies with Telegraf

Something very simple and very useful can be and know the latency to different IP addresses, We can visualize in real time, with soft drink 1 second, the times it takes for IP addresses to respond, they may be private or public; For example, to find out if we have problems with the Internet and where they are, For example 🙂
You'll see how quick and simple! I guess we all have Influxdb and Grafana already installed, If you have any questions, we have this Initial Post. Well, Well, from any machine that has Telegraf installed we will do it in a minute. We will have to decide where we will do the Ping from to know its latency, If we have doubts, the Influxdb machine itself can have the Telegraf agent installed and from there we will do the pings..
We edit the Telegraf file and in the Inputs section it will be enough to add something like this, where in the example we see a Ping to Google's DNS and another to a local IP on my network, a router:
...
[[inputs.ping]]
  URLs = ["8.8.8.8"] # required count = 1
  interface = "ens32"
  name_override = "ping_google"
  interval = "1s"


[[inputs.ping]]
  URLs = ["192.168.0.1"] # required count = 1
  interface = "ens32"
  name_override = "ping_router_movistar"
  interval = "1s"
...
Remember that if we want to use soft drinks 1 second, We must indicate this in the 'interval' and 'flush_interval' parameters. As usual, after tapping configuration file, we restart the Telegraf service and let it read the new config:
sudo systemctl restart telegraf
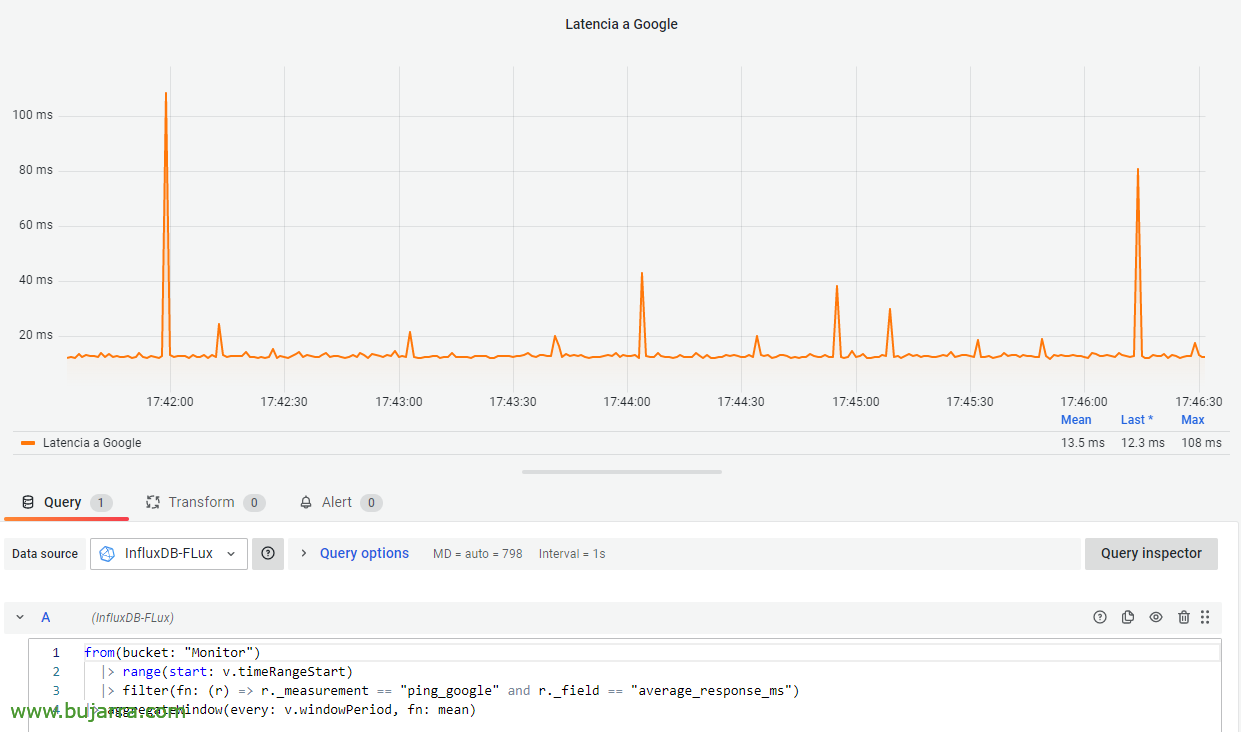
And with this and a cake… we will already have the data in Influxdb, so the next thing will be to go to Grafana! There we will already have the Data Source configured against this Influxdb, and the next thing will be to add a Dashboard in a Dashboard, against said Influxdb Data Source of type Flux and with this query we will have it:
from(bucket: "Monitor")
  |> range(Start: v.timeRangeStart)
  |> filter(Fn: (r) => r._measurement == "ping_google" and r._field == "average_response_ms")
|> aggregateWindow(every: v.windowPeriod, Fn: Mean)

And bam!! ¡We got him! What in a minute? Precious! we already have an example of how to visualize latencies to different IP addresses in real time. You can draw dashboards with traces, routes and know where the bottleneck is, immediately or as a historical consultation of course.
Hugs to all, that way we are modern… Anyway, Now seriously, Take care of yourselves, Thank you for your readings, Little rats, when you like or share on social media… Anyway, Thank you!