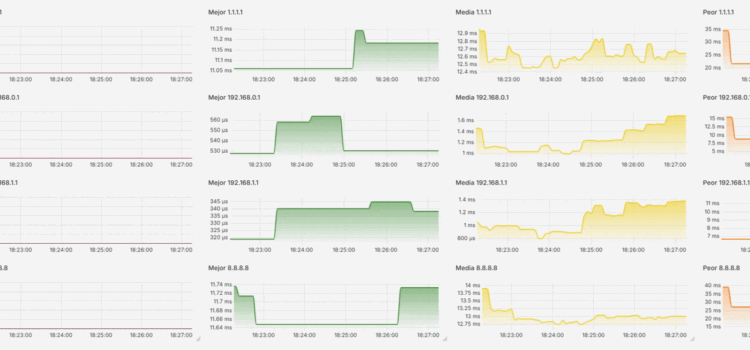
Ping metrics with Prometheus and Grafana

A simple post, that I believe can contribute in any area, And it's nothing more than pinging 😊😂, Let's see I laugh, but it provides interesting information on many occasions. In this post we will see how to send pings to internal/external IP addresses that we are interested in knowing their latency, if there are cuts… and understand it visually with Grafana.

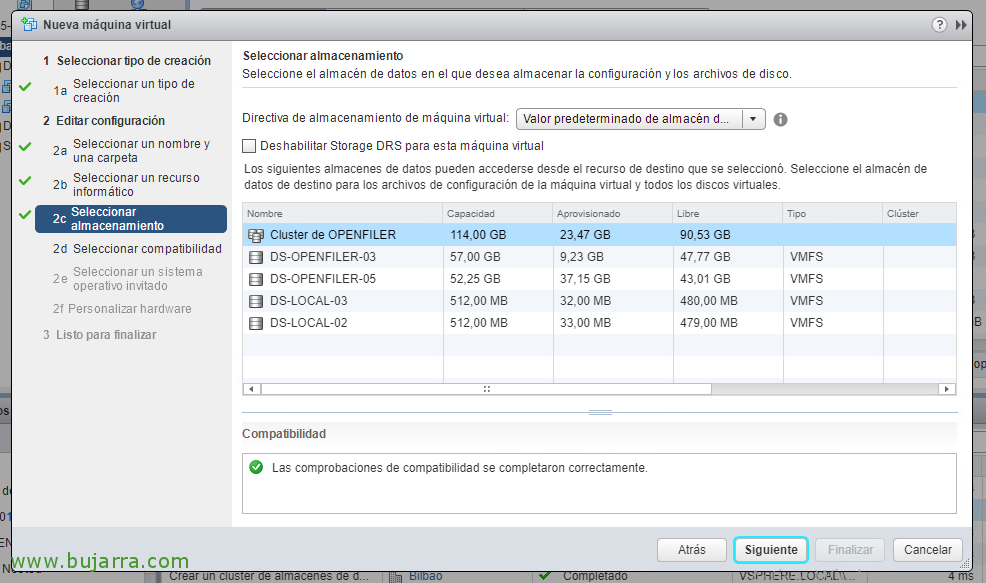
Using Storage DRS in vSphere 6.5

One of the great features that VMware vSphere has is Storage DRS, that as we can imagine, is similar to traditional DRS but with storage, This is, instead of distributing the count (CPU, RAM…), with Storage DRS we will be able to distribute the load of the datastores, balancing so much for performance (Latency to Datastore) and by space used. With this we will have fully distributed the load in terms of disk!
Nagios – Measuring Disk Load in Windows

If we are interested in controlling the load on the disks of our Windows servers, we will be able to monitor it simply thanks to a simple PowerShell that we will run through NRPE. We will obtain read and write latencies, Number of reads and writes per second, as well as the read and write ratio in MB/s and also the read queue time & writing!