

Nagios – Measuring Disk Load in Windows

If we are interested in controlling the load on the disks of our Windows servers, we will be able to monitor it simply thanks to a simple PowerShell that we will run through NRPE. We will obtain read and write latencies, Number of reads and writes per second, as well as the read and write ratio in MB/s and also the read queue time & writing!
GOOD, First things first, we will perform this process using NRPE, I mean, that if you don't have the command 'check_nrpe’ on the Nagios or Centreon appliance, or the NSClient Agent ++ installed on your Windows computer, Reviewed This document!
We will download the PowerShell script that will allow us to do this, Called 'check_ms_win_disk_load.ps1', we can download it from this URL: https://exchange.nagios.org/directory/Plugins/Operating-Systems/Windows-NRPE/Check-Microsoft-Windows-Disk-Load/details.

GOOD, download this script and leave it in the folder '%ProgramFiles%NSClient++\ScriptsScripts‘ of each Windows to be monitored. In addition, we modify the NSClient++ configuration file, The 'nsclient.ini', and we add the following configuration:
[SourceCode][/settings/external scripts/scripts]
disk_load = cmd /c echo scripts\check_ms_win_disk_load.ps1 $ARG 1$; exit($lastexitcode) | powershell.exe -executionpolicy bypass -command –
[/settings/external scripts/alias]
disk_load = disk_load[/SourceCode]

GOOD, we must create a Service for each disk that we are going to monitor, in this example we will see how to get the C Disk Load:\ of a Windows. We create the Service from “Configuration” > “Services” and we clone from an existing one. We set you up at least the following settings:
- Description: We indicate the name with which we will see you from the monitoring, something like 'Disco C – Cargo' can be worth it to us.
- Template: Normally, Select 'generic-active-service-custom'.
- Check Command: Select from the list of commands, 'check_nrpe'.
- Args: Here we must fill in the alias that we define in the INI file, in this document we will pass through NRPE the check 'disk_load'. We will also have to give him some arguments (with -a) where we will indicate the disk and the warning times. In this example I indicate: disk_load -a '-dl C -ms 5 -RQW 20 -RQC 50’
We record with “Save”,
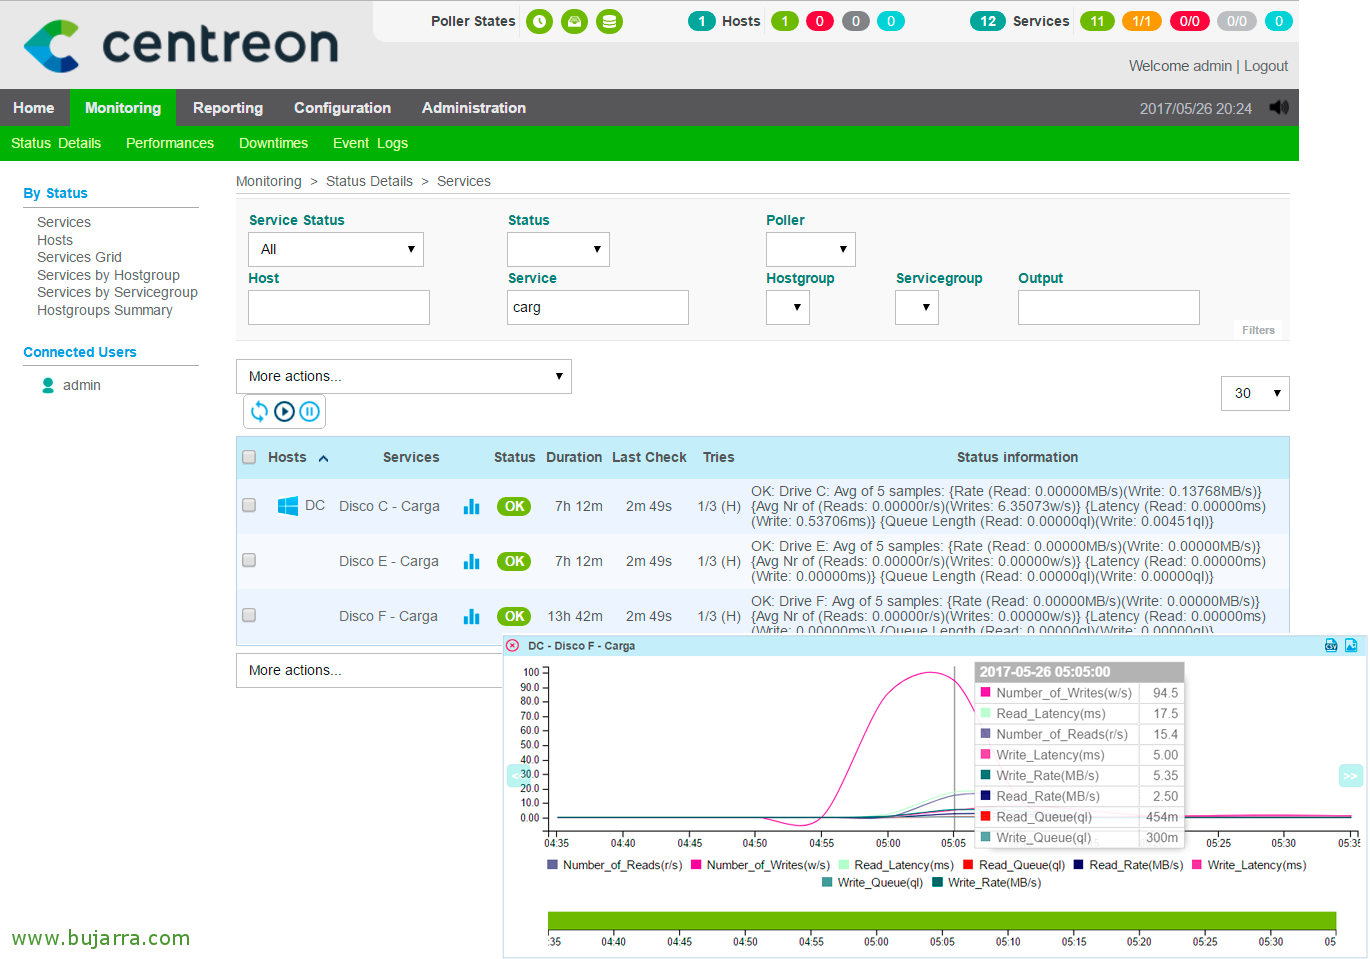
And the usual, after recording the setup in Nagios / Centreon, we will be able to force the check of this Service and verify that you can correctly obtain the data. After a reasonable time, we will now be able to visualize the load that our disks suffer from our servers, We will easily monitor not only the use of, if not the latencies in milliseconds of reading or writing, the number of reads and writes per second, throughput read and write in MB/s and finally read queues & writing!


