Nagios – Monitoring Citrix NetScaler

Continuing a little with Citrix elements that we can monitor… what less than our NetScaler! In this document, we'll see how to monitor a Citrix NetScaler VPX virtual appliance that is currently the Gateway for my Citrix XenDesktop organization. We will monitor its basic consumption such as CPU through SNMP, Memory or disks, but also the connections, your network interfaces or certificates!

In this document we will use a NetScaler 10.5 build 55.8, what we will do first of all is to add the SNMP community to the NetScaler, we can do it by GUI in a simple way. “System” > “SNMP” > “Community” > “Add” and we add the community.

We will also need to add the equipment that will do the SNMP queries, we will do it from “System” > “SNMP” > “Managers” > “Add” and add the IP address of the machine with Nagios or Centreon.
After that, we can record the configuration in the NetScaler,
CPU and Memory,
To monitor Citrix appliance CPU and memory usage, we will base ourselves on a script already existing in our Nagios or Centreon installation, We'll use 'check_snmp', passing the OID in addition to the Warning values & Critical that will be in % followed by the text that will put us in the output we will obtain the desired values.
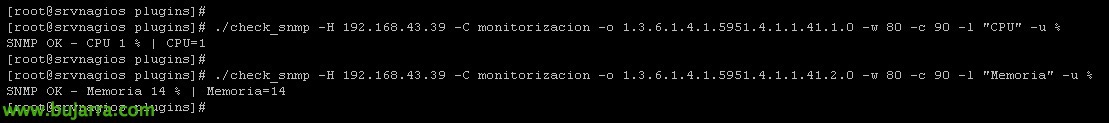
We run from the Nagios shell, in the plugin path:
[SourceCode]./check_snmp -H NETSCALER_IP -C COMUNIDAD_SNMP -O 1.3.6.1.4.1.5951.4.1.1.41.1.0 -w 80 -c 90 -l "CPU" -u %
./check_snmp -H NETSCALER_IP -CCOMUNIDAD_SNMP -o 1.3.6.1.4.1.5951.4.1.1.41.2.0 -w 80 -c 90 -l "Memoria" -u %[/SourceCode]

So if we go to our beloved Centreon, since “Configuration” > “Services” > “Add…” we may add a Service and associate it with the NetScaler host. Be careful, if we have not defined the NetScaler Host in Centreon, it is time to do so, With the generic-host template it will be more than enough. What I said, we create the CPU and Memory service, we must bear in mind that in”Check Command” we must have the existing command called 'check_snmp', where as arguments we will pass the previous UUID, as well as the values for Warning or Critical, or the text we want to read in the output.
Client and server connections,
As with CPU and RAM, We will get the client connections and the server connections in the same way, it will be enough to change the corresponding OID and that's it!

We test whether we want to check the established server and client connections with:
[SourceCode]./check_snmp -H NETSCALER_IP -C COMUNIDAD_SNMP -O 1.3.6.1.4.1.5951.4.1.1.46.10.0 -w 400 -c 500 -l "Conexiones Servidor"
./check_snmp -H NETSCALER_IP -C COMUNIDAD_SNMP -O 1.3.6.1.4.1.5951.4.1.1.46.12.0 -w 400 -c 500 -l "Conexiones Cliente"[/SourceCode]

We come to Centreon again and we also register the Services that will monitor the established Client or Server Connections, we create a couple of Services and associate them with the NetScaler Host, Select the check command 'check_snmp’ again and we complete with the previous OIDs.
Disk,
To monitor the disk usage of a NetScaler we will use another script, that we must download into our Nagios machine, We'll use 'check_netscaler_disk.pl’ to display the occupied space of disk partitions. Download the script from here: https://exchange.nagios.org/directory/Plugins/Network-Protocols/SNMP/check_netscaler_disk/details
We must modify the line 27 of the file correcting the correct path of the plugins, Staying (in my case):
Use lib “/usr/lib/nagios/plugins”;

And we try to run it if we want from the Nagios Shell, from the plugins path and once the script is made executable, Run:
[SourceCode]./check_netscaler_disk.pl -H NETSCALER_IP -C COMUNIDAD_SNMP -w WARNING -c CRITICAL -d[/SourceCode]

We will have to create the Command in Centreon from “Configuration” > “Commands” > “Add”:
- Command Name: We give the command a name, To associate it, it is best to put it the same as the name of the script it executes., in this case 'check_netscaler_disk.pl'.
- Command Type: Select 'Check'.
- Command Line: We indicate what Centreon or Nagios will actually execute when the Service we'll create next calls this command, it would look something like: '/usr/lib/nagios/plugins/check_netscaler_disk.pl -H $HOSTADDRESS$ -C $_HOSTSNMPCOMMUNITY$ -w $ARG 1$ -c $ARG 2$ -d'.
We define the arguments indicating what they are and we record!

Nothing, all that remains is to create the Service that will monitor the disk, since “Configuration” > “Services” and we clone some previous NetScaler service & we modify it or create a new one from “Add…”, being as follows:
- Description: It will be the name under which we will see the service in monitoring, a name like 'Disco' identifies it perfectly or that? ?
- Linked with Hosts: We'll associate it with the NetScaler host.
- Template: Normally 'generic-active-service-custom', it will depend on the ones we use or have modified.
- Check Command: Select the Command we created in the previous step 'check_netscaler_disk.pl'
- Args: This command requires us to complete the 2 Arguments, will be for the value in % for Warning and Critical.
We record with “Save”,

We export the data and reload the settings so that Centreon can read the new changes we just put in. As always we will go to "Configuration" > "Pollers" > "Export configuration", Selecting our poller, We mark the checks and restart & "Export".
And now, from "Monitoring" we will already see all the services that we monitor from a NetScaler VPX. To force and test it, We select him and in the combo we choose: 'Services – Schedule immediate check (Forced)’.
If you want to access the full list of NetScaler OIDs, You can do it from here: http://docs.citrix.com/content/dam/docs/en-us/netscaler/10/downloads/ctx132381.htm
If you want to know how to monitor a certificate that is installed, You can read This document.
If you want to monitor the appliance's network interfaces and control its bandwidths, take a look at This other document, in the 'Monitoring Network Traffic' section.
If you want to verify that a TCP or UDP port is lifted on our NetScaler, You can see it in This document.