Nagios – Monitorizando Windows

In this document we will start with something easy, we are going to monitor our first Windows computer, whether it is a Desktop or a Server. We will monitor the basics through SNMP, be CPU usage, RAM, Disk, Net, Swap Memory and Ping. With this we will have a first base to then add more elements that we need to monitor!!!
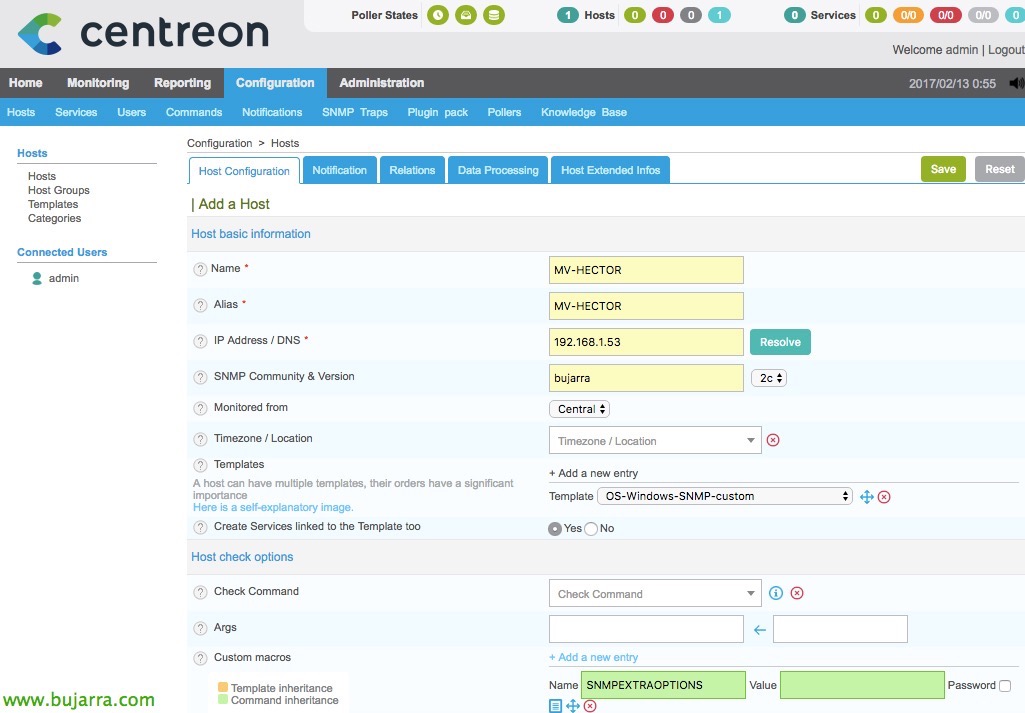
The first thing will be to log in to Centreon as an admin, and since we already have Centreon Plugin Pack installed (We saw it in a Previous Post), We will go to “Configuration” > “Hosts” > “Add”. And we'll add a new host to monitor, will be our Windows machine, and we will configure at least the following options:
- Name: Windows Machine Name.
- Alias: Windows Machine Aliases.
- IP Address: IP address or fqdn hostname of the Windows machine.
- SNMP Community & Version: We will indicate the SNMP community and version that we will later configure on the Windows machine to allow SNMP queries.
- Monitored from: Central or the nearest Poller.
- Template: We will add the template that already comes preconfigured for all the services that will monitor, Choose “OS-Windows-SNMP-custom”.
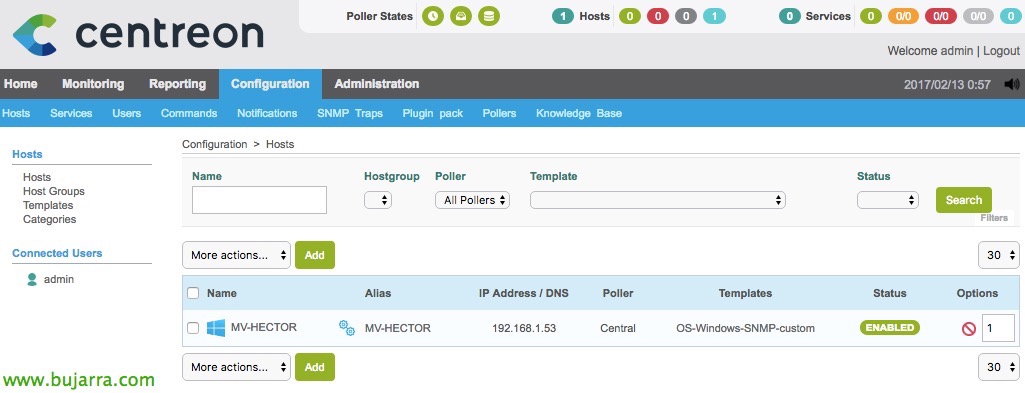
Once added we see it, If we change in sight “Configuration” > “Services”, We'll get something out too.

Now, we must install the SNMP Service on the Windows computer, for this, We will go to “Add or Remove Windows Features” and we'll install it. Once installed, in Windows Services we will already have a new service called “SNMP Service”. If we go to their “Properties”, eyelash “Safety”, we must add the SNMP community and the IP address or hostname of the Nagios server that will monitor it. Once the changes have been applied, We restart the service!

GOOD, Now as always, we will have to apply the changes we made in Centreon so that it generates the Nagios files and loads the configuration. We're going to “Configuration” > “Pollers” > “Export configuration”

Select the team where we want to apply the changes, if in the Central, in a particular Poller or in all, this being a small environment I only have 'Central', We check the checks to generate the configuration, export files and restart the Engine service, Pressed “Export” and if everything has gone correctly we will not have errors in the progress!

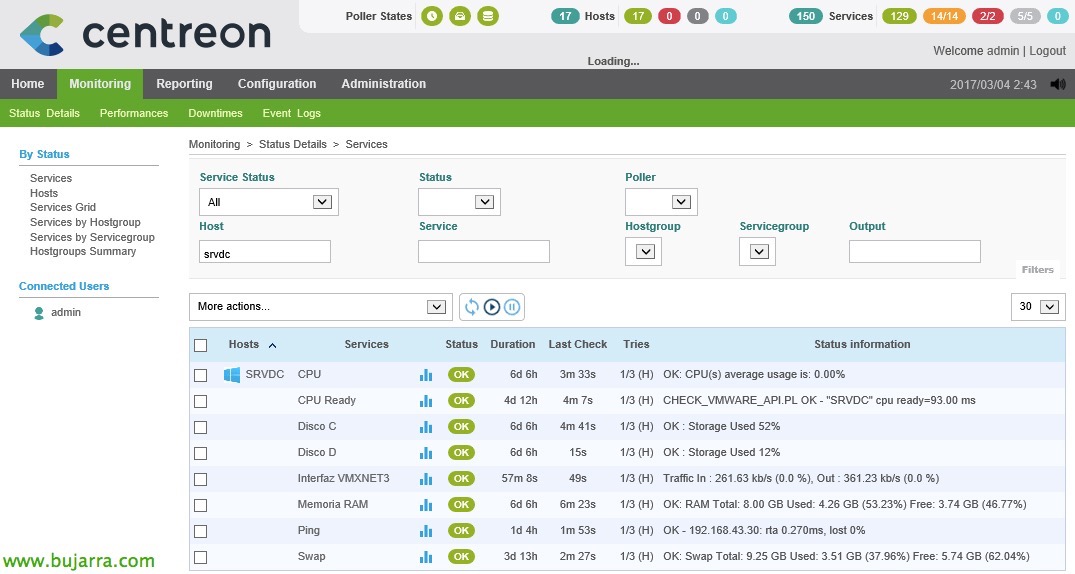
If we are going to “Monitoring” > “Status Details” We will see that the services that monitor that equipment have come out, we force you to check them from “More actions…” > “Services: Schedule immediate check (Forced)”.
And nothing, We'll have something, What charged us with the squad. In my case CPU, RAM, Ping and Memory Swap monitored! If we don't like the names of the services, and I mean that it puts in English 'Memory’ and we want to rename them, We will go to “Configuration” > “Services”, we select it and it will only be enough to modify the 'Description'. If we want this to be a general rule and be done for all future services that we create, we will modify it in the 'Templates’ or templates of the Services.
Adding the Hard Drives,

As we can see, The disk monitoring service has not generated me, In the service templates there is a service for this, But honestly I can't make it work. So, It comes in handy, for example, to explain how to add and be able to rely perfectly on a third-party script. We'll download the script 'check_win_snmp_storage.pl’ of https://exchange.nagios.org/directory/Plugins/Network-Protocols/SNMP/Enhanced-Windows-Disk-Check/details to be able to monitor the different hard drives that each Windows has. I remind you of the website https://exchange.nagios.org to search for any other script of whatever you need. We follow, we uploaded it as always with WinSCP to the Centreon plugins directory '/usr/lib/centreon/plugins/’ And we make it executable with 'chmod +x check_win_snmp_storage.pl’ and we will be able to check by executing the following from the Nagios shell that works like a charm:
[SourceCode]./check_win_snmp_storage.pl MAQUINA_WINDOWS COMMUNITY LETRA_DISCO %WARNING %CRITICAL[/SourceCode]

By the way, I have modified this script one line, since it did not generate graphs for me, You can see the differences in the screenshot that I give you (It's the line 174). Basically I have inserted a pipe to generate the graph, Semicolons’ to separate the data it returns and changed the order somewhat, Just like that..

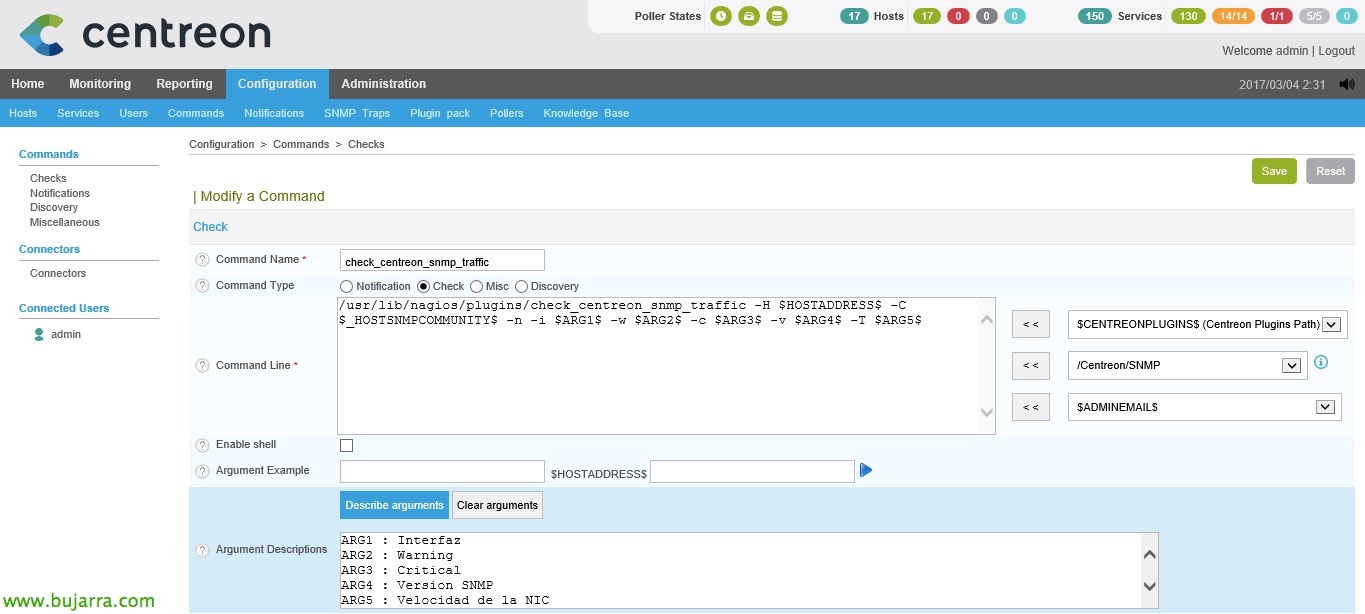
And that's it, a command that we see that works for us in the Nagios shell, we will be able to register it super easily in Centreon. We'll use in command that we just ran in the shell, but now we'll add variables, etc, What better than to see this example. We're going to “Configuration” > “Commands” > “Add” to create a command in Centreon. Eye, that we can also clone it from another command and only change the values that we are interested in (since we still have the check-in times configured, or the type of notification, u Schedule…). Well, We indicate a name, As I have told you on some other occasion, I like to call them the same as the command that runs, in this example 'check_win_snmp_storage.pl'. And in 'Command Type’ We will then put the script that must be executed, In this case:
[SourceCode]$CENTREONPLUGINS$/check_win_snmp_storage.pl $HOSTADDRESS$ $_HOSTSNMPCOMMUNITY$ $ARG 1$ $ARG 2$ $ARG 3$[/SourceCode]
We will now click on “Describe arguments”,
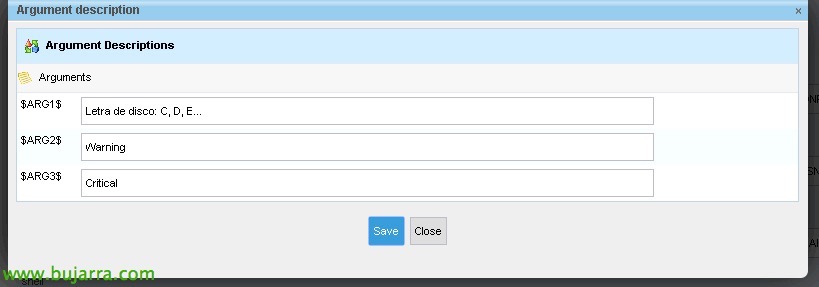
We will indicate what each argument means, for when we believe next (and in the future) The Service, Let's know what each parameter means. In this example, the Argument 1 is the letter of the album to be monitored, The Plot 2 is the percentage value of the Warning and Argument 3 will be the percentage value of the Critical. “Save”.

Now, If we create the service that will monitor a hard drive, We're going to “Configuration” > “Services” > “Add” or clone from an existing service (It's the most comfortable, you'll see it as you use Centreon, since then modifying the command that executes the service and the name would be enough). With nougat, The disk monitoring service will have the following:
- Description: It will be the name we will see when it is monitored, in this case 'Disco X'.
- Linked with hosts: Here we will associate this service with our Windows machines that interest us, In this case I put in 2 computers that have an X hard drive:\.
- Template: Select 'generic-active-service-custom', which normally, we will have modified at the beginning of the Nagios deployment with the base configurations that we will use in these services that we will be creating (We saw this in an initial document).
- Check Command: Select the command we just defined in Centreon, the one that will monitor disk usage, by selecting 'check_win_snmp_storage.pl’ we will get the arguments that this command asks us for and we must add (the ArgsXX).
- Arguments: It will be what the command expects us to add so that it executes correctly, In this case, The command asks for the letter of the disc, the value in % for a Warning Notice and the % for a critical warning.
The rest can be left as it is by default, since it inherits it from the template we choose. We will create as many disk services as we need, are C disks, D, E… and we will associate each of them with each Windows that we monitor!
Monitoring network traffic,
If we also want to know the network traffic of the computers, we will be able to take advantage of a script that already exists in our Nagios, We are talking about the script 'check_centreon_snmp_traffic’ which will be in the Nagios plugin directory (/usr/lib/nagios/plugins/).

So if we go by shell to said directory and run the following command, We will see the network traffic of a machine, in this case he was putting a lot of pressure on the team so that we can see the throughput he spits out… The command will first ask for the hostname or IP address of the computer to be queried, followed by the name of the SNMP community, We will add the name of the network adapter of the computer, then the values of Warning and Critical in %, SNMP version, normally 2 and finally, we must specify the speed of said NIC, In this case it's going to gigabit so I'll leave it at 1000. Example of the command:
[SourceCode]/usr/lib/nagios/plugins/check_centreon_snmp_traffic -H MAQUINA_WINDOWS -C COMUNIDAD -n -i "NOMBRE_NIC" -w WARNING -c CRITICAL -v VERSION_SNMP -T VELOCIDAD_MAX[/SourceCode]
Eye! that if we execute this command, We're doing it as 'root', therefore, then in Centreon, we will see that we will have a permissions error, since the cache file you will create for this host does so with root permissions, and the Centreon user will not have access, The cache is generated in '/var/lib/centreon/centplugins/’ with a filename type 'traffic_cache_192.168.43.77', so with a chown we will give access if necessary to the user 'centreon'’ (or we directly delete the cache and have it recreated). It's just in case you get the case. And if you want to read what your NIC is called, When making a 'cat'’ About the cache file, we will see all the network interfaces that this equipment has.
Well, after proving the above, Not needed, because if we follow these steps it will be enough for us, But we haven't played with the shell… We then create the Centreon command that we will then use in the service that is going to monitor network traffic, as usual, We indicate a name and the next command line that will be executed:
[SourceCode]/usr/lib/nagios/plugins/check_centreon_snmp_traffic -H $HOSTADDRESS$ -C $_HOSTSNMPCOMMUNITY$ -n -i $ARG 1$ -w $ARG 2$ -c $ARG 3$ -v $ARG 4$ -T $ARG 5$[/SourceCode]
Pressed “Describe arguments” to specify what the parameters will be and when creating the service we associate it more easily.

In this command, If we see what we write in the shell with what it asks us, It will be easy, The Plot 1 will be the name of the Network Interface or NIC, The Plot 2 will be the value in % de Warning, The Plot 3 will be the one of the Critical, The Plot 4 will be the SNMP version (that we could have put a 2 in the If we will always use that version… and remove this argument), and finally the Argument 5 will be the maximum speed of the NIC. “Save”,

Time to create the service that will monitor the network traffic of a specific machine! We're going to “Commands” > “Services” > “Add” (or what I said, clone from another and modify). And we'll add the following:
- Description: The usual, the name of the service as we will see it when it is monitored.
- Linked with Hosts: We indicate the host to which we will associate this service.
- Template: As almost always, We use 'generic-active-service-custom'.
- Check Command: We select the command we just created that we'll use to get the network information. We will also fill in the arguments that this command asks us, that we know they are: The name of the network card to be monitored, the numeric value for the warning (normally 80) & Critical (normally 90), SNMP version (normally 2) and the speed of the NIC.
Click on “Save” Oh, well, we will now be able to save our changes in Centreon, we do as at the beginning of the document when we export the configuration to Nagios & We restart the service to load this new configuration.

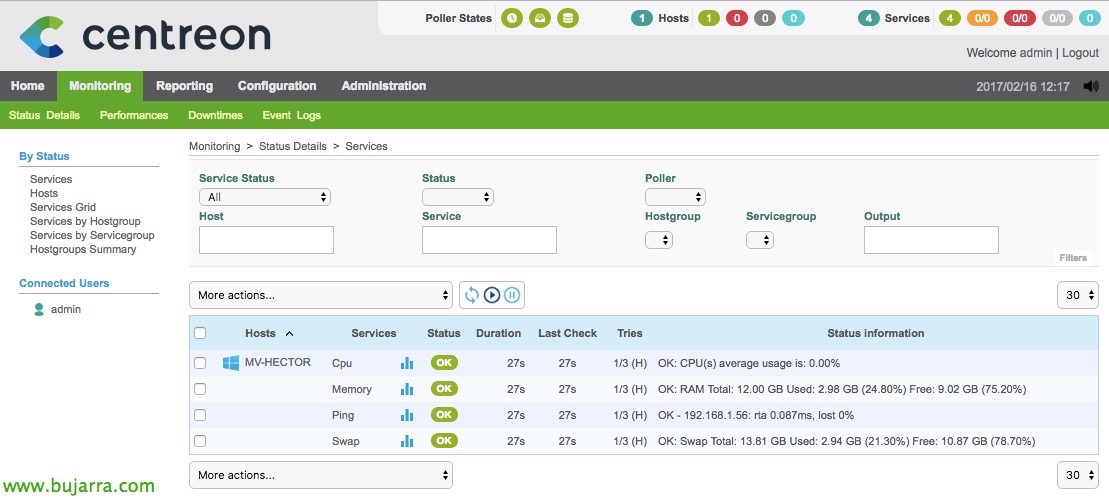
We go back to the “Monitoring” > “Status Details” > “Services” and then we will see the services we have generated, we are waiting for Nagios to run the tests and see the result of the monitoring on Windows. As usual, We know there's no need to wait, that we can select from the 'tick’ in the left column, and in 'More actions…’ select 'Services – Schedule immediate check (Forced)’ and we will therefore force it to monitor these elements!
And if everything has gone well, now we have a Windows computer monitored basically, We will see in the graphs the network consumptions, as well as CPU usage, Disk, RAM or Swap. And as I say this is the basics, No? Then we will add more things that we need, such as the monitoring of the services offered by the machine, etc… we will see later!!!