Nagios – Monitoring our ESXi hosts

In this document, we'll look at all the steps needed to be able to monitor an ESXi host, we will see the most common parameters and the values that we can obtain to have a controlled environment thanks to Nagios and Centreon! All the information we can obtain is amazing! In other documents we will see other information that we can obtain from vCenter and its VMs, Today the hosts are playing!

Installation of requirements,
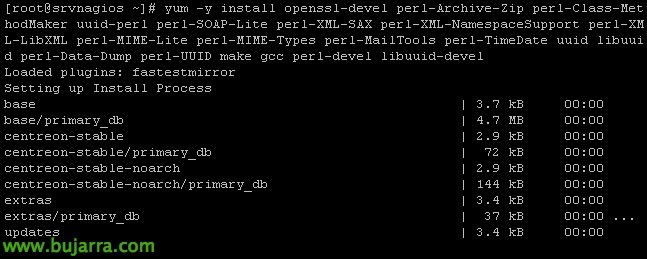
We'll first start by installing all the necessary requirements to use one of the most common scripts we can use. In Nagios Exchange we will be able to obtain almost any script we need, and from there we will download one that I usually use to monitor ESXi 4.x hosts, 5.x or 6.x. But first we will have to install the VMware SDK on the nagios machine as well as everything necessary before.
After having all the requirements installed and tested that the script to monitor ESXi servers works, we will now be able to exit the console and use the Centreon interface to create the ESXi hosts, the services we will monitor and the necessary commands. I hope it is well understood, to follow the steps!
Installing the requirements:
[SourceCode]yum -y install openssl-devel perl-Archive-Zip perl-Class-MethodMaker uuid-perl perl-SOAP-Lite perl-XML-SAX perl-XML-NamespaceSupport perl-XML-LibXML perl-MIME-Lite perl-MIME-Types perl-MailTools perl-TimeDate uuid libuuid perl-Data-Dump perl-UUID make gcc perl-devel libuuid-devel cpan[/SourceCode]

We search the VMware download website, the vSphere SDK for Perl, We download the GZ package from 64 bit.

We upload it to the Nagios server using WinSCP for example and leave it in the temporary directory '/tmp/'. We unzip and install it:
[SourceCode]tar xvzf VMware-vSphere-Perl-SDK-xxxxxxx.tar.gz
cd vmware-vsphere-cli-distrib/
./vmware-install.pl[/SourceCode]
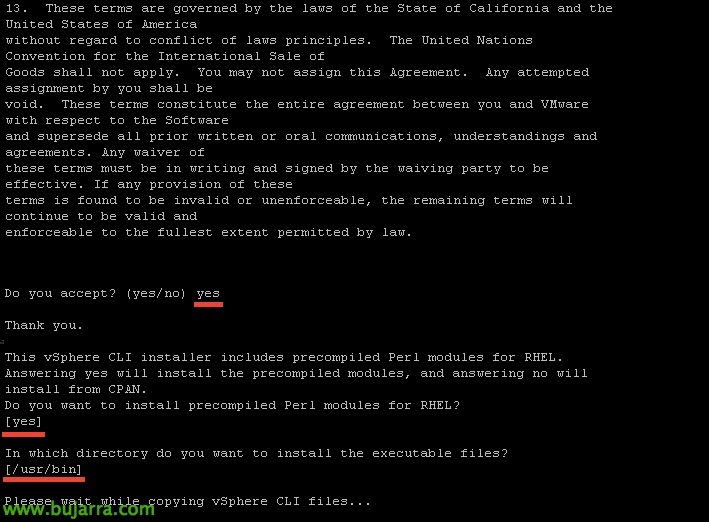
We install it with the default parameters,
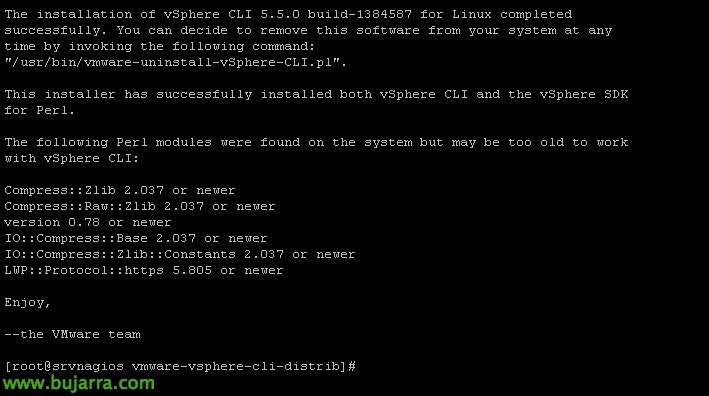
And after a few seconds we will have it installed,

We install UUID:
[SourceCode]cd /usr/src
WGET HTTP://search.cpan.org/CPAN/authors/id/J/JN/JNH/UUID-0.04.tar.gz
tar -xzvf UUID-0.04.tar.gz -C /opt[/SourceCode]

We compile it:
[SourceCode]cd /opt/UUID-0.04
Pearl Makefile.PL
Make[/SourceCode]

And we installed it, as well as 'perl-Nagios-Plugin’ that will also be necessary:
[SourceCode]make install
yum install perl-Nagios-Plugin[/SourceCode]
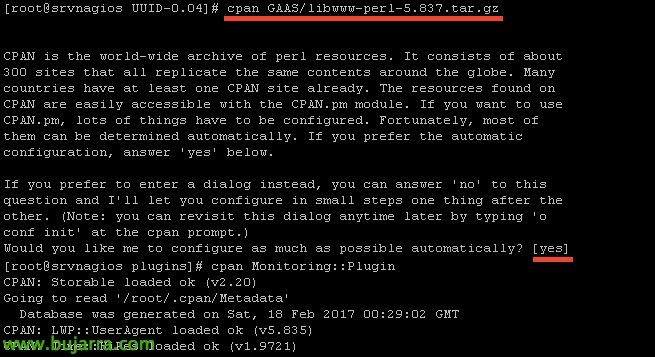
We install more requirements:
[SourceCode]CPAN GAAS/libwww-perl-5.837.tar.gz[/SourceCode]
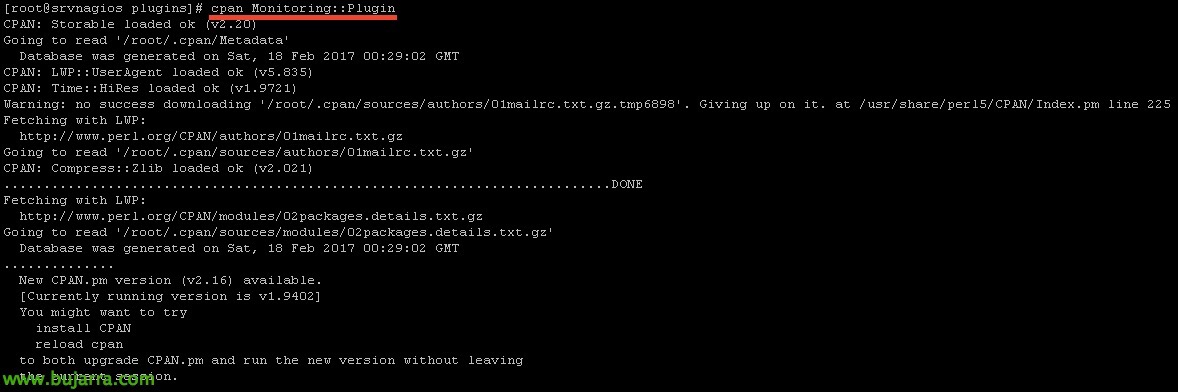
And we are finishing with the latter!
[SourceCode]cpan Monitoring::Plugin[/SourceCode]

At last, We will be able to download the script that will allow us to obtain information from the hosts here https://exchange.nagios.org/directory/Plugins/Operating-Systems/*-Virtual-Environments/VMWare/check_vmware_api/details Once downloaded, we will leave the file 'check_vmware_api.pl’ at '/usr/lib/centreon/plugins/’ And we'll make it executable with 'chmod +x check_vmware_api.pl'. We will try to run it and if everything is correct this screen will appear indicating the options that we can use.
Creating a privileged user in ESXi,
The Above Script, will need to be validated against the ESXi host to obtain the information we are interested in, therefore we will create a user in each ESXi and give the necessary permissions.

In each ESXi, after logging in well with the traditional client or the web browser, We will go to the area of “Users” And we'll create one, We will also set your password.
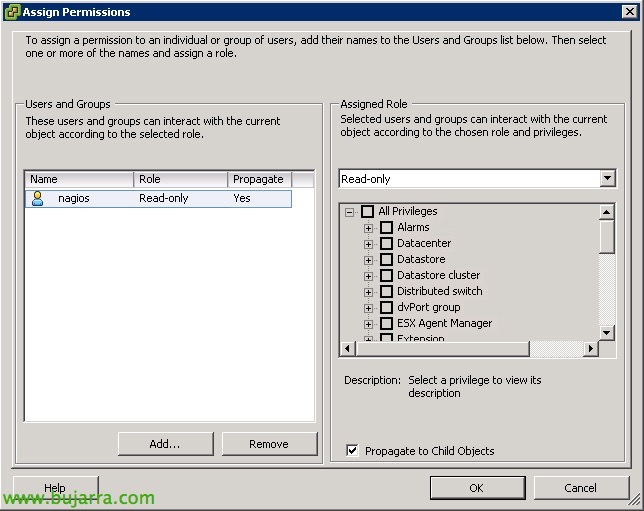
On the “Permissions”, We'll add this user to as much scope as possible, and we'll add it with the 'Read-Only' role.
Now, We will create in the directory that interests us (I leave it in the same plugins) a file, where we will store the username and password that the command will use to validate itself when it does the checks. In this example I save it to '/usr/lib/centreon/plugins/check_vmware_api.auth’ with the following format:
[SourceCode]username=user
password=Password[/SourceCode]

And we can already run any check against an ESXi host, Something simple to try, CPU usage:
[SourceCode]./check_vmware_api.pl -H SERVIDOR_ESXI -f check_vmware_api.auth -l cpu -s usage -w 80 -c 90[/SourceCode]
The parameters that accompany the command are all described below, in the previous command '-w’ will be the % Warning when Warning and '-c’ the value of when it is Critical. I tell you this because it is common in almost all commands, and everyone who uses the ones we want, In these documents you will find that normally when you reach the 80% will be something Warning and when it reaches the 90% will be Critical.
Now all that remains is to choose the elements that we are most interested in monitoring, At the end of the document I will put all the possibilities that this excellent command 'check_vmware_api.pl' gives us. But for now I give you the most common examples to monitor information from an ESXi host:
RAM Usage:
[SourceCode]./check_vmware_api.pl -H SERVIDOR_ESXI -f check_vmware_api.auth -l mem -s usage -w 80 -c 90[/SourceCode]
Swap Memory Usage
[SourceCode]./check_vmware_api.pl -H SERVIDOR_ESXI -f check_vmware_api.auth -l mem -s swap -w 1 -c 10[/SourceCode]
Using Balloning Memory
[SourceCode]./check_vmware_api.pl -H SERVIDOR_ESXI -f check_vmware_api.auth -l mem -s memctl -w 1 -c 10[/SourceCode]
Network usage
[SourceCode]./check_vmware_api.pl -H SERVIDOR_ESXI -f check_vmware_api.auth -l net -s usage -w 10240 -c 102400[/SourceCode]
Detect if we have a fallen NIC,
[SourceCode]./check_vmware_api.pl -H SERVIDOR_ESXI -f check_vmware_api.auth -l net -s nic -w 1 -c 2[/SourceCode]
Monitor VMFS datastores, in this, Command returns free use, so we will indicate with the following format in Warning and Critical the % of clearance,
[SourceCode]./check_vmware_api.pl -H SERVIDOR_ESXI -f check_vmware_api.auth -l vmfs -s -s LUN04 -w 10%: -c 5%:[/SourceCode]
For example with the 'runtime' parameter’ We'll look at an overview of the server, and optionally we can add other options such as 'health’ to see health, 'temperature’ to view temperature sensors, or 'status’ to see a summary among others.
[SourceCode]./check_vmware_api.pl -H SERVIDOR_ESXI -f check_vmware_api.auth -l runtime
./check_vmware_api.pl -H SERVIDOR_ESXI -f check_vmware_api.auth -l runtime -s health
./check_vmware_api.pl -H SERVIDOR_ESXI -f check_vmware_api.auth -l runtime -s temperature
./check_vmware_api.pl -H SERVIDOR_ESXI -f check_vmware_api.auth -l runtime -s status[/SourceCode]
If we use the parameter 'service’ we will be able to see the status of all ESXi services if they are running or not, and additionally we can add the name of the services that we are interested in monitoring only.
[SourceCode]./check_vmware_api.pl -H SERVIDOR_ESXI -f check_vmware_api.auth -l service
./check_vmware_api.pl -H SERVIDOR_ESXI -f check_vmware_api.auth -l service -s DCUI vpxa[/SourceCode]
For now, I think this is enough for us, No? Since the script 'check_vmware_api.pl’ It still has many more things that you can browse and we will see in other posts, it would also be useful to monitor Host clusters, Data Centers, Virtual Machines, etc… Another day ;), Now we continue with the hosts!
Creating a host,
Here we will finally register in Nagios our first server, an ESXi host! We will use Centreon to make all the work easier.

Since “Configuration” > “Hosts” > “Add”, We'll add our first server, We will complete at least the following fields:
- Name: Server Name.
- Alias: Server Aliases.
- IP Address / DNS: The IP address or DNS name of the server.
- SNMP Community & Version: In this case it would not be necessary.
- Monitored from: The poller that will monitor this host.
- Template: Select 'generic-active-host'.
Creating a Command,
We will define a Command in Centreon using variables to be able to execute the commands we saw before, this command will then be called from each Service we create to monitor the CPU, RAM… What better way to see it than to understand it 🙂
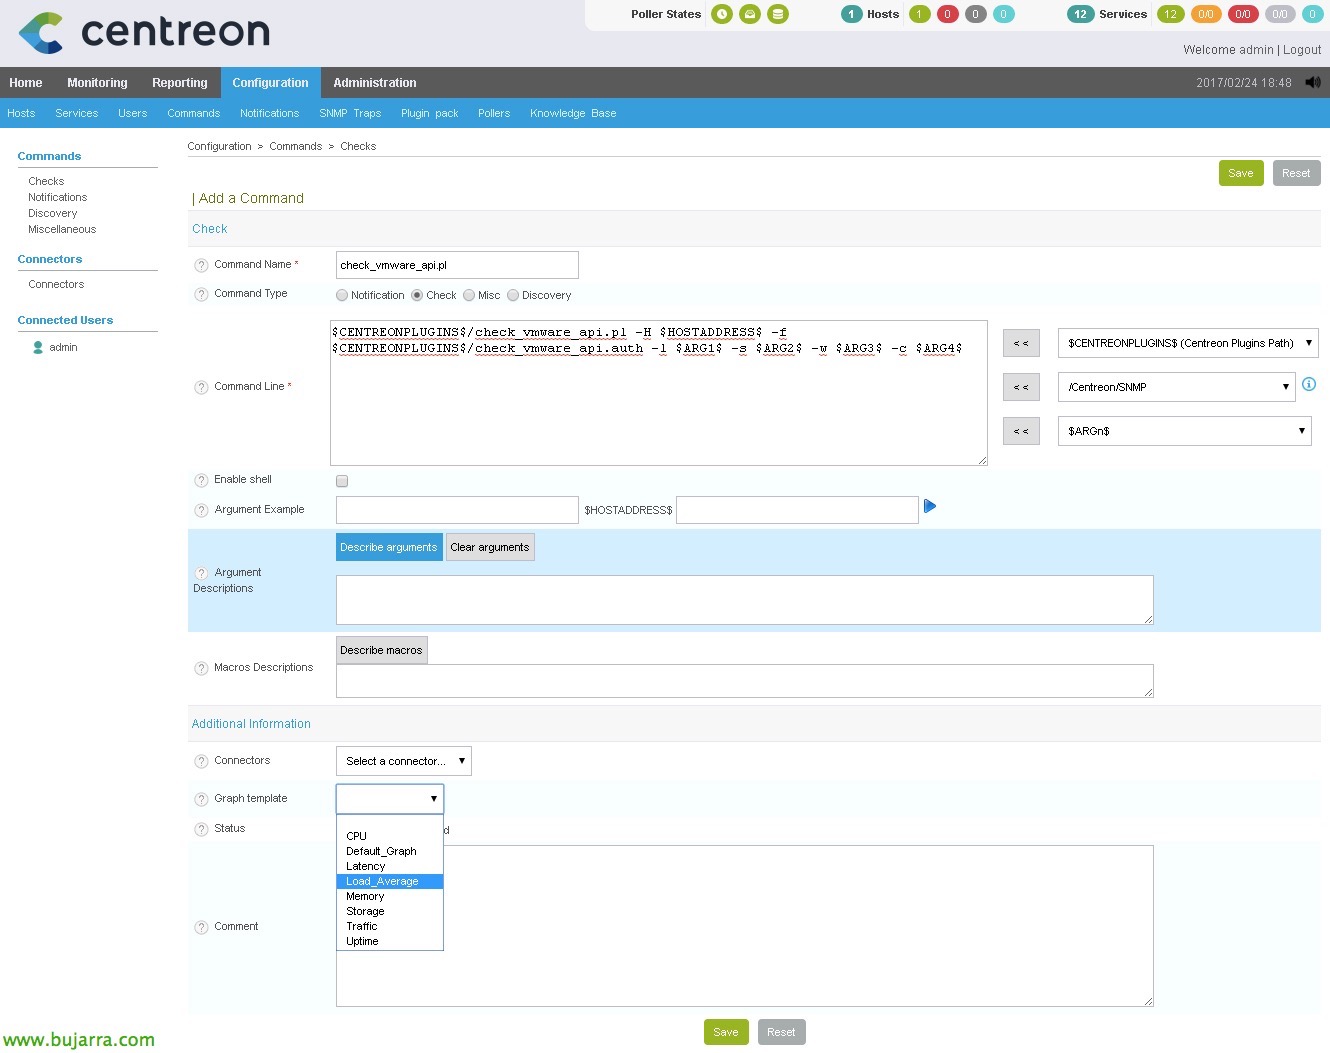
I usually like to call the Command the same as the script, therefore, In this case I will create the command 'check_vmware_api.pl'. To do this,, since “Configuration” > “Commands” > “Checks” > “Add”. We indicate that it is a command of type 'Check’ and in the 'Command line we indicate':
[SourceCode]$CENTREONPLUGINS$/check_vmware_api.pl -H $HOSTADDRESS$ -f $CENTREONPLUGINS$/check_vmware_api.auth -l $ARG 1$ -s $ARG 2$ -w $ARG 3$ -c $ARG 4$[/SourceCode]
- The variable $CENTREONPLUGINS$ is '/usr/lib/centreon/plugins/’
- The variable $HOSTADDRESS$ would be the IP address or FQDN name of the server to be monitored.
- ARG1 would be the first argument we'll pass on to you, if we remember it is the 'Command’ indicated after '-l'.
- ARG2 would be the first argument we'll pass on to it,if we remember it is the 'SubCommand’ indicated after '-s'.
- ARG3 will be the value of Warning.
- ARG4 will be the value of Critical.
Click on “Describe arguments” so I don't have to memorize and know this.

So we associate in a simple way what each Argument is, that later when we create the services, We will appreciate it. “Save”.
Creating the services,
Here we can finally create the services of what we want to monitor, be CPU, RAM, Dropped NICs, Datastore status… for this, We will support each other as we have said in the command that we have just created! Look how easy it is:

In “Configuration” > “Services” > “Add”, We will create our first service! We will fill in at least the following information:
- Description: Service Name, in my case CPU, RAM, Swap Memory…
- Linked with Hosts: Here we will add the host we have created before, our ESXi server.
- Template: Select 'generic-active-service'.
- Check Command: We choose the command we created earlier as well, that in my case I call it the script 'check_vmware_api.pl’
- Arguments: We must fill in all the arguments that the command asks us to.
- CPU usage: CPU / usage / 80 / 90
- RAM: Mem / usage / 80 / 90
- Swap Memory: Mem / swap / 1 / 10
- Balloning Memory: Mem / Memctl / 1/ 10
- NIC Status: Net / Nic / 1 / 2
- …
We record with “Save”,
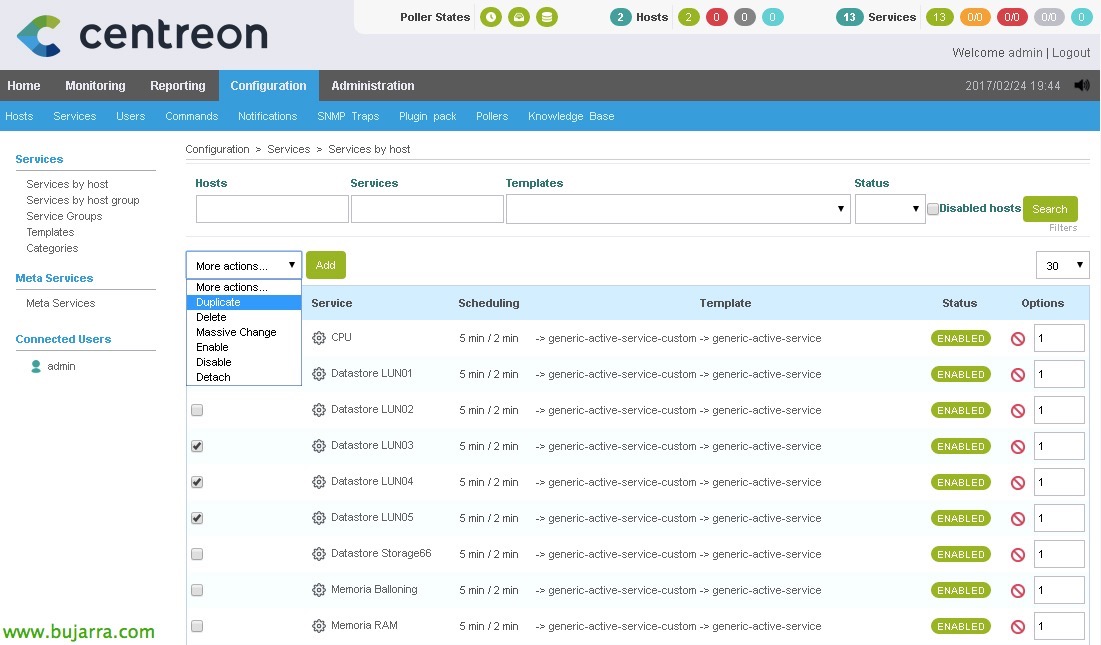
To create the rest of the services, instead of creating them all from scratch, the most comfortable thing will be to duplicate them, This way we will only have to edit the arguments and it will be much easier to create the services.

Once we have created all the services associated with an ESXi host, if we now want to duplicate the work done to monitor another ESXi host that we have, Or as many as we have, since “Configuration” > “Hosts”, we will select the ESXi we have and duplicate it, With that we generate a new host, to which we will have to change the Name, Alias and IP Address and we will have another host ready with the same services!
And nothing, The usual, Once the work is finished, We save the changes, Cenreon will generate the necessary nagios files, “Configuration” > “Pollers” > “Export configuration”,

We select our poller, We mark the checks and restart & “Export”,

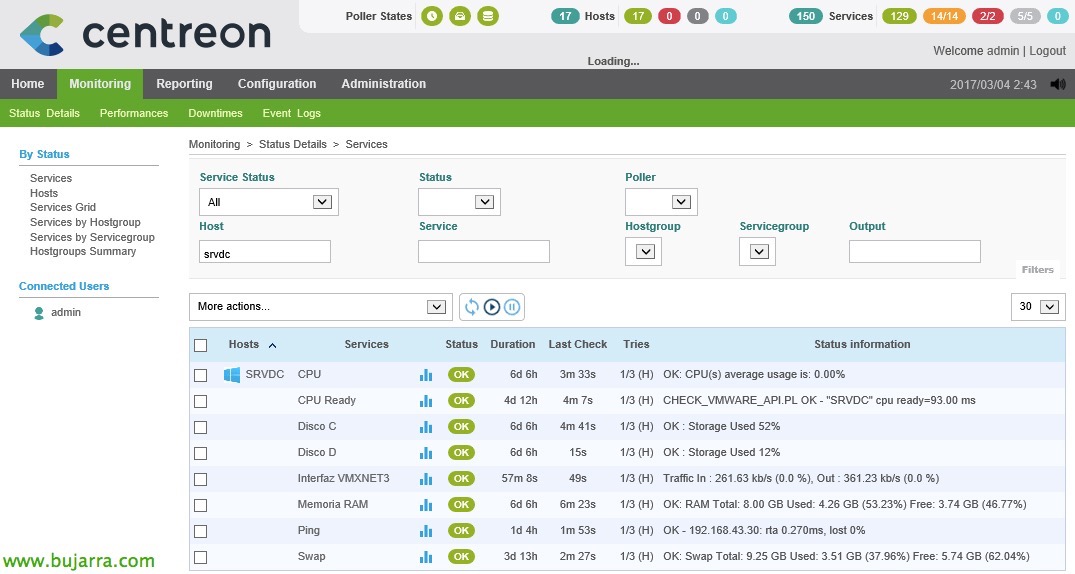
Once everything is generated, We can now go to the monitoring part and check that everything we have done works! We'll look at all the new services we've created that monitor different things. Si queremos forzar el checkeo, ya sabemos, seleccionamos los servicios que nos interesen y en el combo seleccionamos ‘Services – Schedule immediate check (Forced)’.
Y aquí os dejo todas las posibilidades del comando:
[SourceCode]Usage: check_vmware_api.pl -D <data_center> | -H <host_name> [ -C <cluster_name> ] [ -N <vm_name> ]
-u <user> -p <pass> | -f <authfile>
-l <command> [ -s <subcommand> ] [ -T <timeshift> ] [ -i <interval> ]
[ -x <black_list> ] [ -or <additional_options> ]
[ -t <timeout> ] [ -w <warn_range> ] [ -c <crit_range> ]
[ -V ] [ -h ]
-?, –usage
Print usage information
-h, –help
Print detailed help screen
-V, –version
Print version information
–extra-opts=[section][@file]
Read options from an ini file.
for usage and examples.
-H, –host=<hostname>
ESX or ESXi hostname.
-C, –cluster=<clustername>
ESX or ESXi clustername.
-D, –datacenter=<DCname>
Datacenter hostname.
-N, –name=<vmname>
Virtual machine name.
-u, –username=<username>
Username to connect with.
-p, –password=<password>
Password to use with the username.
-f, –authfile=<path>
Authentication file with login and password. File syntax :
username=<login>
password=<password>
-w, –warning=THRESHOLD
Warning threshold. See
for the threshold format. By default, no threshold is set.
-c, –critical=THRESHOLD
Critical threshold. See
for the threshold format. By default, no threshold is set.
-l, –command=COMMAND
Specify command type (CPU, MEM, NET, IO, VMFS, RUNTIME, …)
-s, –subcommand=SUBCOMMAND
Specify subcommand
-S, –sessionfile=SESSIONFILE
Specify a filename to store sessions for faster authentication
-x, –exclude=<black_list>
Specify black list
-or, –options=<additional_options>
Specify additional command options (quickstats, …)
-T, –timestamp=<timeshift>
Timeshift in seconds that could fix issues with "Unknown error". Use values like 5, 10, 20, etc
-i, –interval=<sampling period>
Sampling Period in seconds. Basic historic intervals: 300, 1800, 7200 or 86400. See config for any changes.
Supports literval values to autonegotiate interval value: r – realtime interval, h<number> – historical interval specified by position.
Default value is 20 (realtime). Since cluster does not have realtime stats interval other than 20(default realtime) is mandatory.
-M, –maxsamples=<max sample count>
Maximum number of samples to retrieve. Max sample number is ignored for historic intervals.
Default value is 1 (latest available sample).
–trace=<level>
Set verbosity level of vSphere API request/respond trace
–generate_test=<file>
Generate a test case script from the executed command/subcommand and write it to <file>. If <file> is "stdout", the test case script is written to stdout instead.
-t, –timeout=INTEGER
Seconds before plugin times out (default: 30)
-v, –verbose
Show details for command-line debugging (can repeat up to 3 times)
Supported commands(^ – blank or not specified parameter, or – options, T – timeshift value, b – blacklist) :
VM specific :
* CPU – shows cpu info
+ usage – CPU usage in percentage
+ usagemhz – CPU usage in MHz
+ wait – CPU wait time in ms
+ ready – CPU ready time in ms
^ all cpu info(no thresholds)
* Mem – shows mem info
+ usage – mem usage in percentage
+ usagemb – mem usage in MB
+ swap – swap mem usage in MB
+ swapin – swapin mem usage in MB
+ swapout – swapout mem usage in MB
+ overhead – additional mem used by VM Server in MB
+ overall – overall mem used by VM Server in MB
+ active – active mem usage in MB
+ Memctl – mem used by VM memory control driver(vmmemctl) that controls ballooning
^ all mem info(except overall and no thresholds)
* Net – shows net info
+ usage – overall network usage in KBps(Kilobytes per Second)
+ receive – receive in KBps(Kilobytes per Second)
+ send – send in KBps(Kilobytes per Second)
^ all net info(except usage and no thresholds)
* io – shows disk I/O info
+ usage – overall disk usage in MB/s
+ read – read disk usage in MB/s
+ write – write disk usage in MB/s
^ all disk io info(no thresholds)
* Runtime – shows runtime info
+ with – connection state
+ CPU – allocated CPU in MHz
+ Mem – allocated mem in MB
+ state – virtual machine state (UP, DOWN, SUSPENDED)
+ status – overall object status (gray/green/red/yellow)
+ consoleconnections – console connections to VM
+ guest – guest OS status, needs VMware Tools
+ tools – VMware Tools status
+ issues – all issues for the host
^ all runtime info(except con and no thresholds)
Host specific :
* CPU – shows cpu info
+ usage – CPU usage in percentage
o quickstats – switch for query either PerfCounter values or Runtime info
+ usagemhz – CPU usage in MHz
o quickstats – switch for query either PerfCounter values or Runtime info
^ all cpu info
o quickstats – switch for query either PerfCounter values or Runtime info
* Mem – shows mem info
+ usage – mem usage in percentage
o quickstats – switch for query either PerfCounter values or Runtime info
+ usagemb – mem usage in MB
o quickstats – switch for query either PerfCounter values or Runtime info
+ swap – swap mem usage in MB
o listvm – turn on/off output list of swapping VM’s
+ overhead – additional mem used by VM Server in MB
+ overall – overall mem used by VM Server in MB
+ Memctl – mem used by VM memory control driver(vmmemctl) that controls ballooning
o listvm – turn on/off output list of ballooning VM’s
^ all mem info(except overall and no thresholds)
* Net – shows net info
+ usage – overall network usage in KBps(Kilobytes per Second)
+ receive – receive in KBps(Kilobytes per Second)
+ send – send in KBps(Kilobytes per Second)
+ Nic – makes sure all active NICs are plugged in
^ all net info(except usage and no thresholds)
* io – shows disk io info
+ aborted – aborted commands count
+ resets – bus resets count
+ read – read latency in ms (totalReadLatency.average)
+ write – write latency in ms (totalWriteLatency.average)
+ kernel – kernel latency in ms
+ device – device latency in ms
+ queue – queue latency in ms
^ all disk io info
* vmfs – shows Datastore info
+ (Name) – free space info for datastore with name (Name)
o used – output used space instead of free
o brief – list only alerting volumes
o regexp – whether to treat name as regexp
o blacklistregexp – whether to treat blacklist as regexp
b – blacklist VMFS’s
T (value) – timeshift to detemine if we need to refresh
^ all datastore info
o used – output used space instead of free
o brief – list only alerting volumes
o blacklistregexp – whether to treat blacklist as regexp
b – blacklist VMFS’s
T (value) – timeshift to detemine if we need to refresh
* Runtime – shows runtime info
+ with – connection state
+ health – checks cpu/storage/memory/sensor status and propagates worst state
o listitems – list all available sensors(use for listing purpose only)
o blackregexpflag – whether to treat blacklist as regexp
b – blacklist status objects
+ storagehealth – storage status check
o blackregexpflag – whether to treat blacklist as regexp
b – blacklist status objects
+ temperature – temperature sensors
o blackregexpflag – whether to treat blacklist as regexp
b – blacklist status objects
+ sensor – threshold specified sensor
+ maintenance – shows whether host is in maintenance mode
o maintwarn – sets warning state when host is in maintenance mode
o maintcrit – sets critical state when host is in maintenance mode
+ list(vm) – list of VMware machines and their statuses
+ status – overall object status (gray/green/red/yellow)
+ issues – all issues for the host
b – blacklist issues
^ all runtime info(health, storagehealth, temperature and sensor are represented as one value and no thresholds)
* service – shows Host service info
+ (names) – check the state of one or several services specified by (names), syntax for (names):<service1>,<service2>,…,<serviceN>
^ show all services
* storage – shows Host storage info
+ adapter – list bus adapters
b – blacklist adapters
+ lun – list SCSI logical units
b – blacklist LUN’s
+ path – list logical unit paths
b – blacklist paths
^ show all storage info
* Uptime – shows Host uptime
o quickstats – switch for query either PerfCounter values or Runtime info
* device – shows Host specific device info
+ cd/dvd – list vm’s with attached cd/dvd drives
o listall – list all available devices(use for listing purpose only)
DC specific :
* CPU – shows cpu info
+ usage – CPU usage in percentage
o quickstats – switch for query either PerfCounter values or Runtime info
+ usagemhz – CPU usage in MHz
o quickstats – switch for query either PerfCounter values or Runtime info
^ all cpu info
o quickstats – switch for query either PerfCounter values or Runtime info
* Mem – shows mem info
+ usage – mem usage in percentage
o quickstats – switch for query either PerfCounter values or Runtime info
+ usagemb – mem usage in MB
o quickstats – switch for query either PerfCounter values or Runtime info
+ swap – swap mem usage in MB
+ overhead – additional mem used by VM Server in MB
+ overall – overall mem used by VM Server in MB
+ Memctl – mem used by VM memory control driver(vmmemctl) that controls ballooning
^ all mem info(except overall and no thresholds)
* Net – shows net info
+ usage – overall network usage in KBps(Kilobytes per Second)
+ receive – receive in KBps(Kilobytes per Second)
+ send – send in KBps(Kilobytes per Second)
^ all net info(except usage and no thresholds)
* io – shows disk io info
+ aborted – aborted commands count
+ resets – bus resets count
+ read – read latency in ms (totalReadLatency.average)
+ write – write latency in ms (totalWriteLatency.average)
+ kernel – kernel latency in ms
+ device – device latency in ms
+ queue – queue latency in ms
^ all disk io info
* vmfs – shows Datastore info
+ (Name) – free space info for datastore with name (Name)
o used – output used space instead of free
o brief – list only alerting volumes
o regexp – whether to treat name as regexp
o blacklistregexp – whether to treat blacklist as regexp
b – blacklist VMFS’s
T (value) – timeshift to detemine if we need to refresh
^ all datastore info
o used – output used space instead of free
o brief – list only alerting volumes
o blacklistregexp – whether to treat blacklist as regexp
b – blacklist VMFS’s
T (value) – timeshift to detemine if we need to refresh
* Runtime – shows runtime info
+ list(vm) – list of VMware machines and their statuses
+ listhost – list of VMware esx host servers and their statuses
+ listcluster – list of VMware clusters and their statuses
+ tools – VMware Tools status
b – blacklist VM’s
+ status – overall object status (gray/green/red/yellow)
+ issues – all issues for the host
b – blacklist issues
^ all runtime info(except cluster and tools and no thresholds)
* recommendations – shows recommendations for cluster
+ (Name) – recommendations for cluster with name (Name)
^ all clusters recommendations
Cluster specific :
* CPU – shows cpu info
+ usage – CPU usage in percentage
+ usagemhz – CPU usage in MHz
^ all cpu info
* Mem – shows mem info
+ usage – mem usage in percentage
+ usagemb – mem usage in MB
+ swap – swap mem usage in MB
o listvm – turn on/off output list of swapping VM’s
+ Memctl – mem used by VM memory control driver(vmmemctl) that controls ballooning
o listvm – turn on/off output list of ballooning VM’s
^ all mem info(plus overhead and no thresholds)
* cluster – shows cluster services info
+ effectivecpu – total available cpu resources of all hosts within cluster
+ effectivemem – total amount of machine memory of all hosts in the cluster
+ failover – VMware HA number of failures that can be tolerated
+ cpufairness – fairness of distributed cpu resource allocation
+ memfairness – fairness of distributed mem resource allocation
^ only effectivecpu and effectivemem values for cluster services
* Runtime – shows runtime info
+ list(vm) – list of VMware machines in cluster and their statuses
+ listhost – list of VMware esx host servers in cluster and their statuses
+ status – overall cluster status (gray/green/red/yellow)
+ issues – all issues for the cluster
b – blacklist issues
^ all cluster runtime info
* vmfs – shows Datastore info
+ (Name) – free space info for datastore with name (Name)
o used – output used space instead of free
o brief – list only alerting volumes
o regexp – whether to treat name as regexp
o blacklistregexp – whether to treat blacklist as regexp
b – blacklist VMFS’s
T (value) – timeshift to detemine if we need to refresh
^ all datastore info
o used – output used space instead of free
o brief – list only alerting volumes
o blacklistregexp – whether to treat blacklist as regexp
b – blacklist VMFS’s
T (value) – timeshift to detemine if we need to refresh[/SourceCode]