Installing Graphite and Grafana to visualize Centreon's graphics

In this document we are going to hallucinate… especially if you are a fan of graph measurement and want to exploit them… we will be able to export the results of our Centreon to a machine with Grafana and obtain the best solution for the visualization of our data… The dashboards that we will be able to generate will be impressive, We will customize them to our liking, combining metrics or intervals of each item that we have monitored with Centreon. And super simple!
Centreon (inter alia) allows you to export the data you collect to Time Series Database format (TSDB), because thanks to it, we can store them in a Graphite Database and with Grafana present that data in beautiful Dashboards. Grafana is an Open platform to create our own dashboards that allow us to monitor our infrastructure. In this document, we'll look at how to install Graphite and Grafana on a machine with CentOS 7. Therefore, our Centreon or Nagios will monitor our platform as it has done so far, but also, we will redirect the metrics it monitors to a remote database, and Grafana will be able to read this information and thus we will create the Dashboard that interests us!
Note that this document does not have to be used only for Nagios or Centreon, but we will see in future documents how to read information and treat it from MySQL databases for example, You'll see how interesting, We will see future measurements of electricity consumption of home or company, Or anything we can think of, It is really impressive and especially if we then put this on a screen in our apartment. Or in our homes with a magic mirror like MagicMirror that I will tell you about, already… and I will even dare to put photos of what I have assembled at home so that you can see how impressive it is.
Graphite Installation,
The Centreon machine in this example has the IP address 192.168.1.57 and the Centos where we will install Graphite and Grafana will be the 192.168.1.104. Started!!
To install Graphite, we will use the EPEL repository, if you don't have it installed, you must do so, and we install Graphite and the necessary packages:
[SourceCode]yum install -y epel-release
Yum install -y httpd graphite-web python-carbon perl[/SourceCode]
We initialize the graphite interface and start it by running:
[SourceCode]/usr/bin/graphite-manage syncdb –No input
/usr/bin/graphite-build-index
/usr/bin/chown -R apache:Apache /var/lib/graphite-web
systemctl start carbon-cache[/SourceCode]
We edit the welcome file and comment on everything with hash pads (#).
[SourceCode]vim /etc/httpd/conf.d/welcome.conf[/SourceCode]
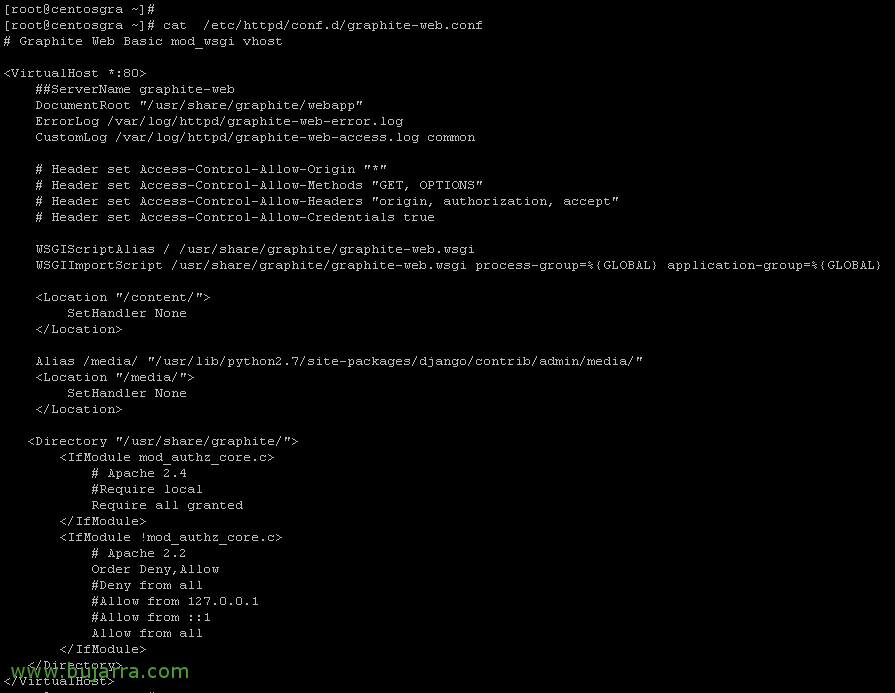
We modify the file '/etc/httpd/conf.d/graphite-web.conf’ to allow access from any IP:
[SourceCode]##ServerName graphite-web
<IfModule mod_authz_core.c>
# Apache 2.4
Require all granted
</IfModule>
<IfModule !mod_authz_core.c>
# Apache 2.2
Order Deny,Allow
Allow from all
</IfModule>[/SourceCode]
And we restart the service to reload the configuration with:
[SourceCode]systemctl restart httpd[/SourceCode]
In addition to adding a couple of rules that will allow external access to the Graphite port and web access, We restart the firewall to reload the configuration, for this:
[SourceCode]firewall-cmd –zone=public –Permanent –add-service=http
firewall-cmd –zone=public –Permanent –add-port=2003/tcp
firewall-cmd –Reload[/SourceCode]
Eye, we must indicate that the services start at the beginning with the Centos machine, Yes? To this end, we execute:
[SourceCode]Chkconfig httpd on
chkconfig grafana-server on
chkconfig carbon-cache on[/SourceCode]
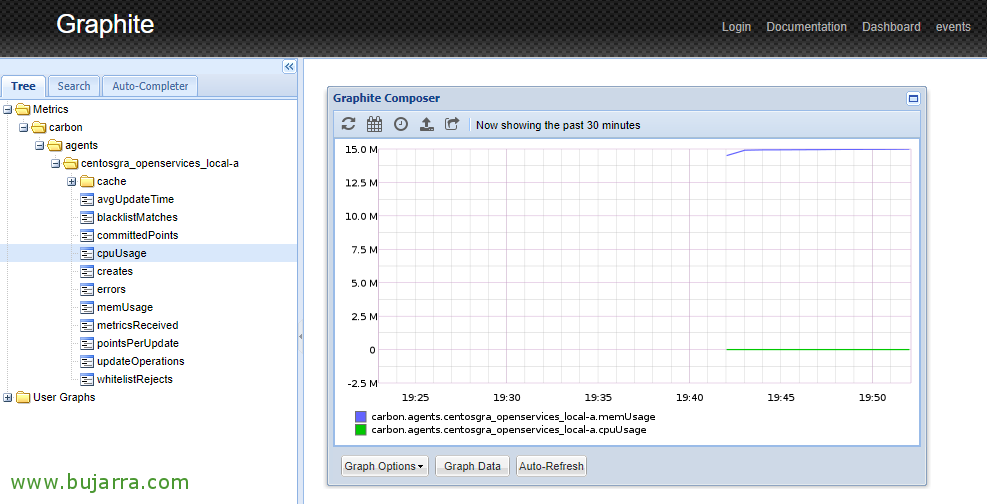
We can try opening Graphite to see if we have access and see the default agent if it contains some information, for this it will not be easier than opening a browser against the IP address of the CentOS, In this case as easy as HTTP://192.168.1.104 and see what data we have…
Redirect output from Centreon to Graphite,
GOOD, now we will have the Centreon Broker write the data to Graphite as well, to do this, we must follow the following steps on the machine where we have installed Centreon!
We install the plugin we will need in the Broker with:
[SourceCode]yum install -y centreon-broker-graphite[/SourceCode]
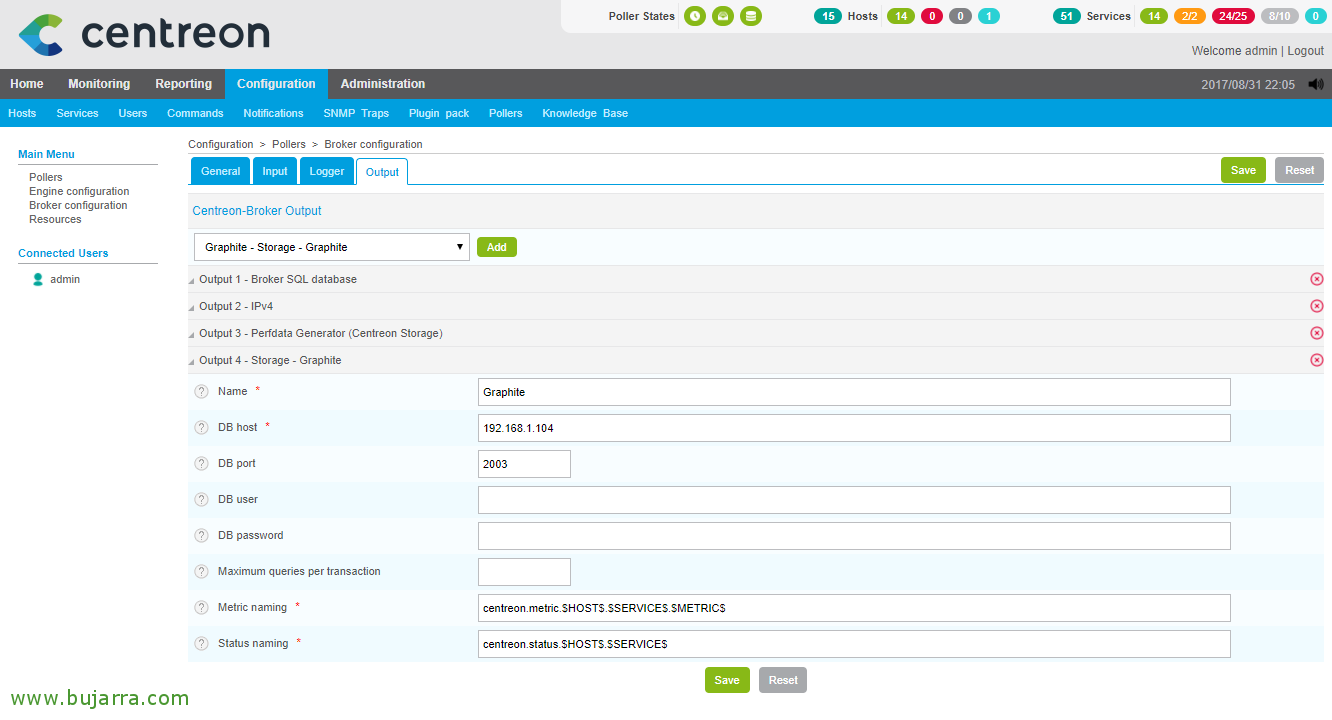
And now we can open the GUI configuration of our Centreon, We're going to “Configuration” > “Pollers” > “Broker configuration” > “central-broker-master” > Eyelash “Output” > In the Output combo we choose 'Graphite – Storage – Graphite’ > “Add”, We complete the following fields as follows:
- Name: Graphite
- DB host: 192.168.1.104 (Graphite IP address)
- DB port: 2003
- DB user:
- DB password:
- Metric naming: centreon.metric.$HOST$.$SERVICE$.$METRIC$
- Status naming: centreon.status.$HOST$.$SERVICE$
With this we indicate where the information collected by our Centreon will be exported and in what format it will be sent to our Graphite (and then we will see it in Grafana).
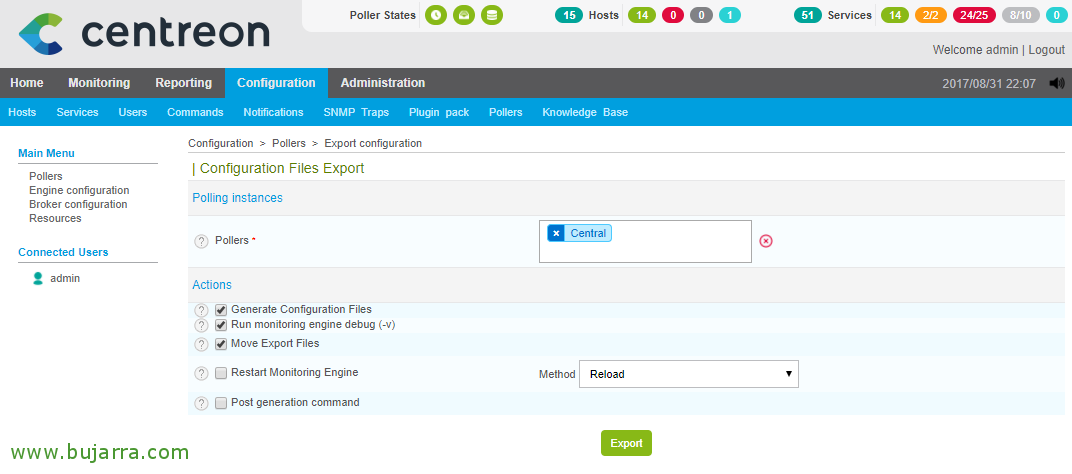
As usual, remember that after any configuration change, we need to reload the config in Centreon, for this, we will do it from: “Configuration” > “Pollers” > “Export configuration” > Mark “Generate Configuration files” & “Run monitoring engine debug” & “Move Export Files” & at Method we select “Reload”, We finally click on “Export” And we wait…
After that, I recommend you to restart these two Centreon services from their shell, we connect with a Putty or whatever we want to the Centreon machine and execute:
[SourceCode]Service CBD Restart
Service Centengine Restart[/SourceCode]
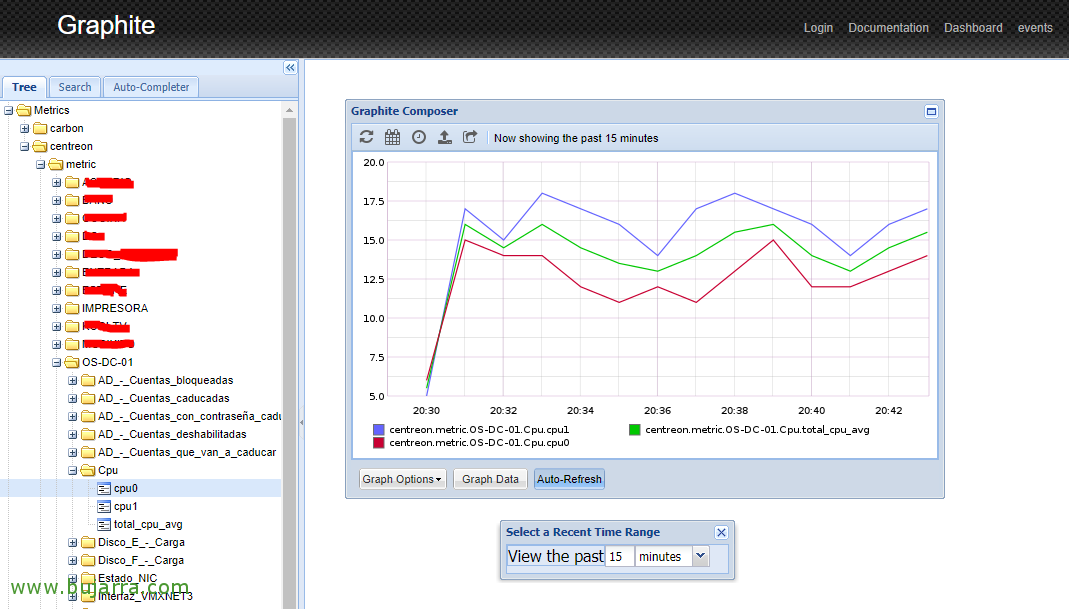
If we want, we can go back to Graphite again to see how we already have new metrics coming from our beloved Centreon… Things are going well, No?
Grafana Installation
Back to our machine with CentOS, Let's go ahead and install and configure Grafana!
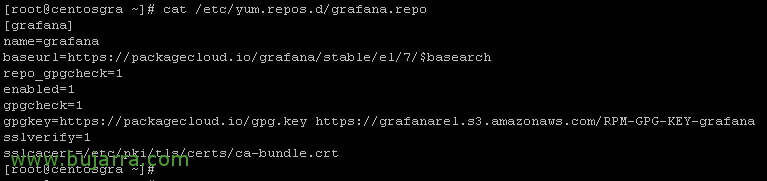
The first thing will be to add a new Repository to our machine, for this, We create the file '/etc/yum.repos.d/grafana.repo’ with the following content:
[SourceCode][Grafana]
name=grafana
baseurl=https://packagecloud.io/grafana/stable/el/7/$basearch
repo_gpgcheck=1
enabled=1
gpgcheck=1
gpgkey=https://packagecloud.io/gpg.key https://grafanarel.s3.amazonaws.com/RPM-GPG-KEY-grafana
sslverify=1
sslcacert=/etc/pki/tls/certs/ca-bundle.crt[/SourceCode]
And we proceed to install Grafana and start its service:
[SourceCode]yum install -y grafana
Systemctl Start grafana-server[/SourceCode]
We add port access to the firewall of the machine itself 3000 to be able to connect to Grafana from any computer & we reload with:
[SourceCode]firewall-cmd –zone=public –Permanent –add-port=3000/tcp
firewall-cmd –Reload[/SourceCode]
And that's it!! We already have (i) Graphite installed and configured, (Ii) our Centreon that already sends the data to this machine and (Iii) an installed Grafana that will be able to interpret the data obtained and show it to us in dashboards as that singing bullfighter said… 'im-pressing'!!!
Accessing Grafana and creating our first dashboard,

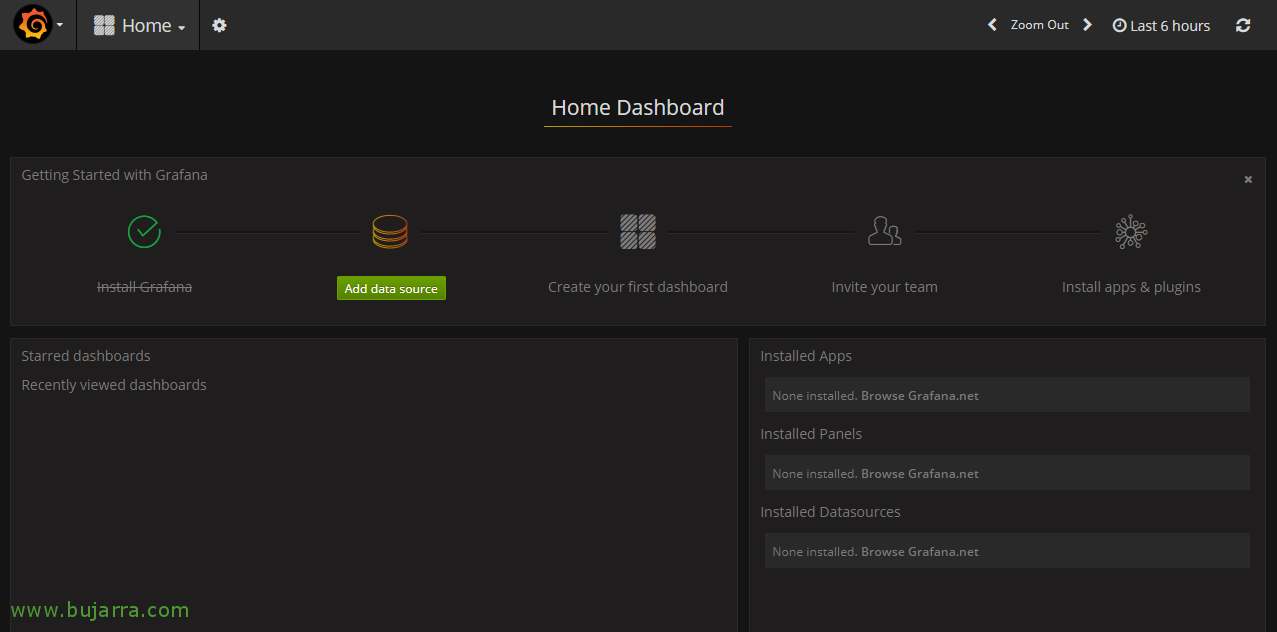
We can already open a browser against the IP address of our machine with CentOS and connect to grafana, in my example it will be against this direction: HTTP://192.168.1.104:3000 and we validate with the default admin user with password 'admin'.
First of all, you'll need to set up a data source, that is, let's tell you that Grafana can read the data from the Graphite DB, We first click on “Add data source”,
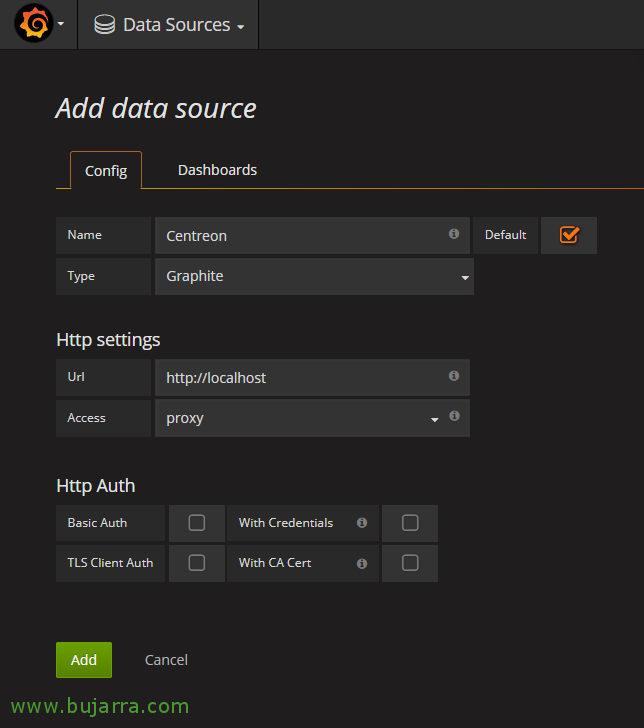
And in this connector we indicate:
- Name: Centreon
- Type: Graphite
- URL: HTTP://localhost
And click on “Add”, As I said, with this we will make Grafana be able to read the data from the local machine, by Graphite. In other documents we will see how to add other data sources to process and exploit other types of information in Grafana.
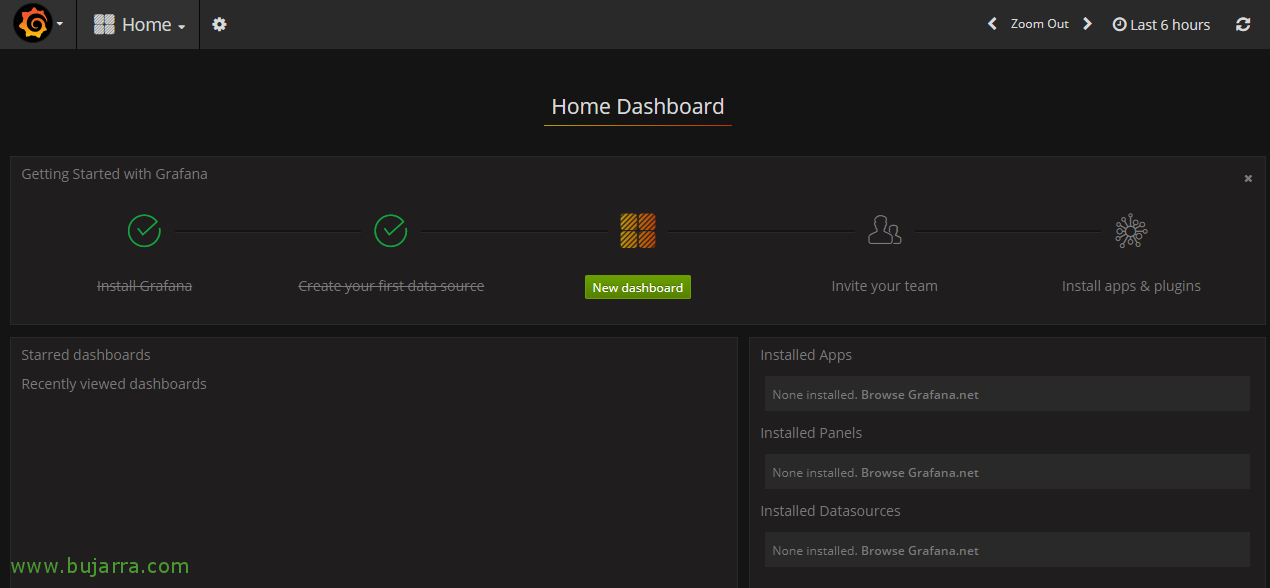
Following up with this introductory wizard, We will click on “New dashboard” to create our first Dashboard!

And well, honestly, using Grafana is super super simple, we will be able to add different types of panels in each Dashboard, We start with the most typical, which is nothing more than the 'Graph type'’ which as we will understand are graphics, can be linear, in columns, Staked… you will discover all that, It's very, very intuitive!!!

It will create this first panel that we can resize to make it look more or less large, By double-clicking on the title we can edit it, Click on “Edit”,
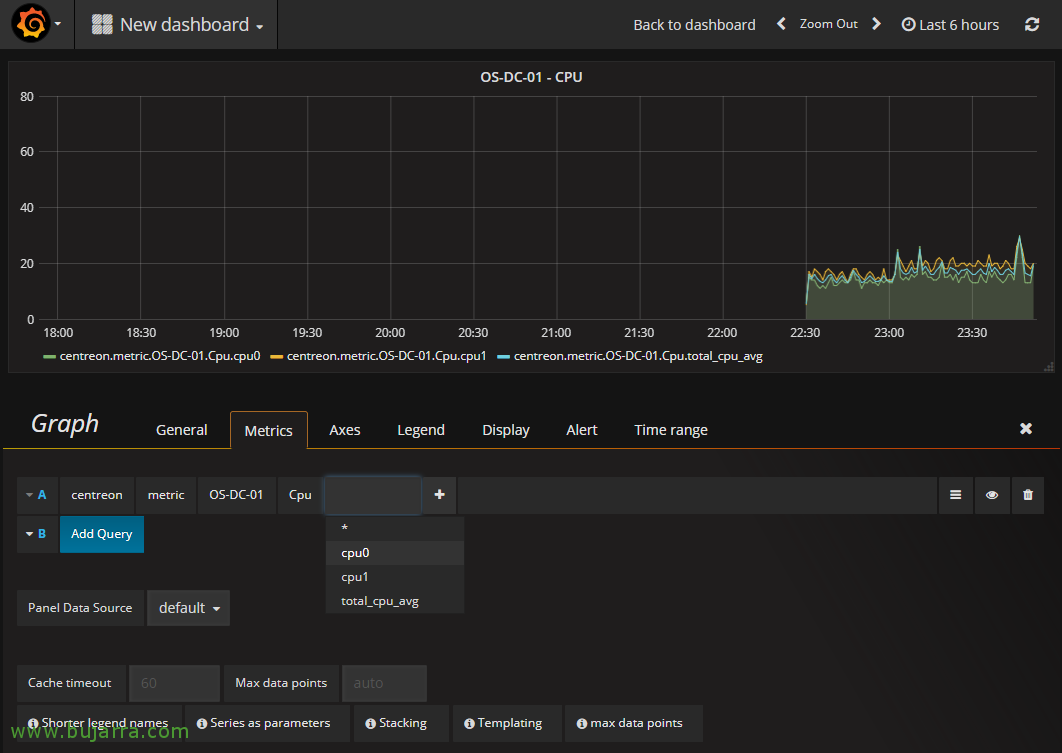
And as the great Tamariz would say… Tiarararaaa!!!! oh magic!!! Attentive….
This Panel can show whatever we want, We have multiple tabs (General, Metrics, Axes, Legend, Display…) that I encourage you to discover or be patient and in future posts I will give you concrete examples. But come on, in the 'Metrics' tab’ we can add the metrics that we are interested in seeing, Let's make a very simple example, we add that it is of the 'Centreon' type’ > 'metric’ > 'SERVER’ > 'ITEM MONITORED', And bam.!!!! will show it in the graph, we can already see any server or device that we monitor with Centreon here!! It will bring out both its name and all the services that we monitor from Centreon!!! Olé, olé and olé Rigodón!!!

What do you think?? Don't tell me we can't think about what to visualize and how, with stunning graphics with Grafana?
By dedicating a little time to it, we can create dashboards with the panels that interest us, each Panel with its metrics, whatever they are, and you will see that they can be customized to the fullest, to leave it as we like it best… to prove that in some future document we will return to Grafana to see more possibilities!!!