Installing Logstash

In this post we will continue with the deployment of the solution, today we will see how to properly install Logstash; will be the tool to collect LOGs and process them before storing them in Elasticsearch.

Logstash takes care of collecting, parse and filter the logs to later give them some output and store them in a database. We work with different Inputs or Input Types, where we can indicate what we are going to collect, Any type of log, of system, of specific applications, then we can Filter by log type, if with errors only… we will treat them based on our need to finally store them through Outputs or Types of Outputs, in our case in Elasticsearch. Therefore we will have 3 Sections in the settings to watch out for:
[SourceCode]Input {
...
}[/SourceCode]
Where the information comes from? We can use text files, Application or service logs, as well as any Beat app we use.
[SourceCode]filter {
...
}[/SourceCode]
Describe what you will do with each data entry, whether to parse or modify it or ignore certain data, for example.
[SourceCode]output {
...
}[/SourceCode]
Indicates where you will redirect the leaked data, In our case we will always use the same thing, Elasticsearch
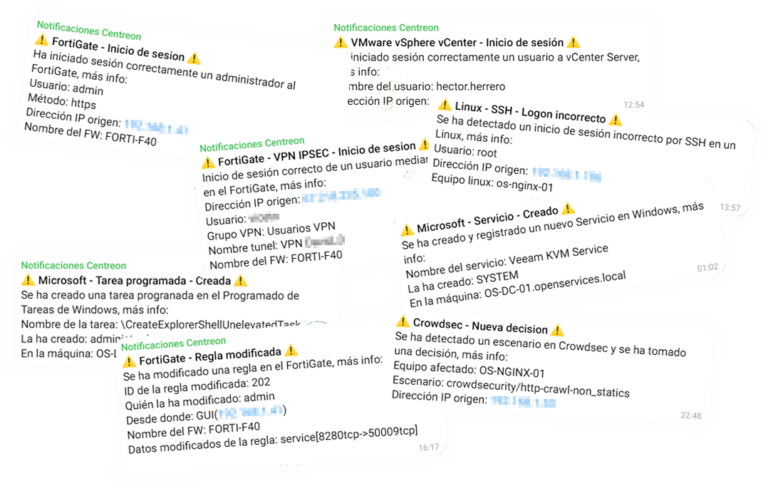
We will see in a series of example documents how to use Logstash to parse logs of Linux servers as an Apache, Windows Event Viewer events, Fortigate Firewall Logs… and how with the filters we will read logs in plain text files and we will be able to convert data as interesting as IP addresses into geolocation data, to get their exact position and visualize the data on maps. All this without forgetting we can have real-time visualization or consult between date periods.
Install Logstash,
Like any tool in the Stack you will need Java Virtual Machine, so we install OpenJDK and verify that we have the OK installation. By the way, if we are installing it on the same machine as Elasticsearch we will already have this requirement fulfilled:
[SourceCode]apt-get install openjdk-8-jre-headless java -version[/SourceCode]
To install, first we download and add the Elastic public key, and we add the repository, we update the package list and proceed to install Logstash:
[SourceCode]wget -qO - https://artifacts.elastic.co/GPG-KEY-elasticsearch | Sudo apt-key add -
ECHO &Quot;Deb https://artifacts.elastic.co/packages/6.x/apt stable main&Quot; | tee -a /etc/apt/sources.list.d/elastic-6.x.list apt-get update apt-get install logstash[/SourceCode]
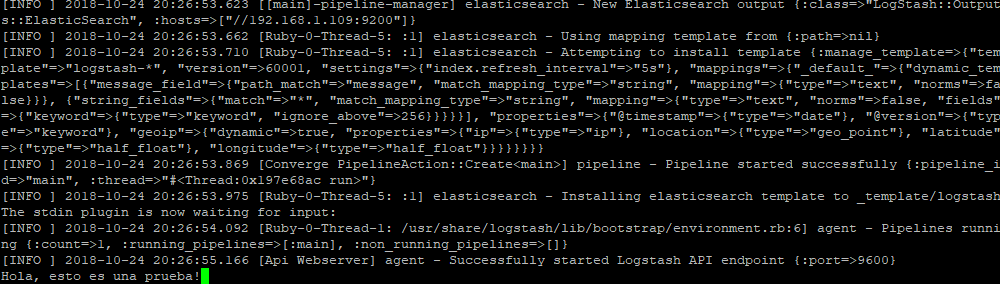
To verify that the installation was correct, before starting the service we can run the binary and send it example information to verify the installation and that the access to Elasticsearch is correct. With this basic config we will validate it:
[SourceCode]cd /usr/share/logstash bin/logstash -e 'input { Stink { } } output { ElasticSearch { hosts=≫ [&Quot;Direccion_IP_Elasticsearch:9200&Quot;] } }'[/SourceCode]
A few messages will come out and then we can put an example text and click on the [Enter], e.g:
[SourceCode]Hello! This is a test![/SourceCode]

Download Postman (HTTP Diagnostic Tool) From our team, and we make a GET to get all the documents you find in the index:
[SourceCode]HTTP://Dirección_IP_Elasticsearch:9200/logstash-*/_search[/SourceCode]
We press SEND and we see the result! There is a connection between them! 🙂
[SourceCode]Ctr+C[/SourceCode]
We will now be able to lift the Logstash service and enable it to start automatically with the machine!
[SourceCode]systemctl enable logstash service logstash start[/SourceCode]
Creating the index in Kibana and visualizing the data,
In the next post we will see the installation of Kibana, Once we have it installed, we will be able to create the pattern of the Logstash indexes and visualize the data.
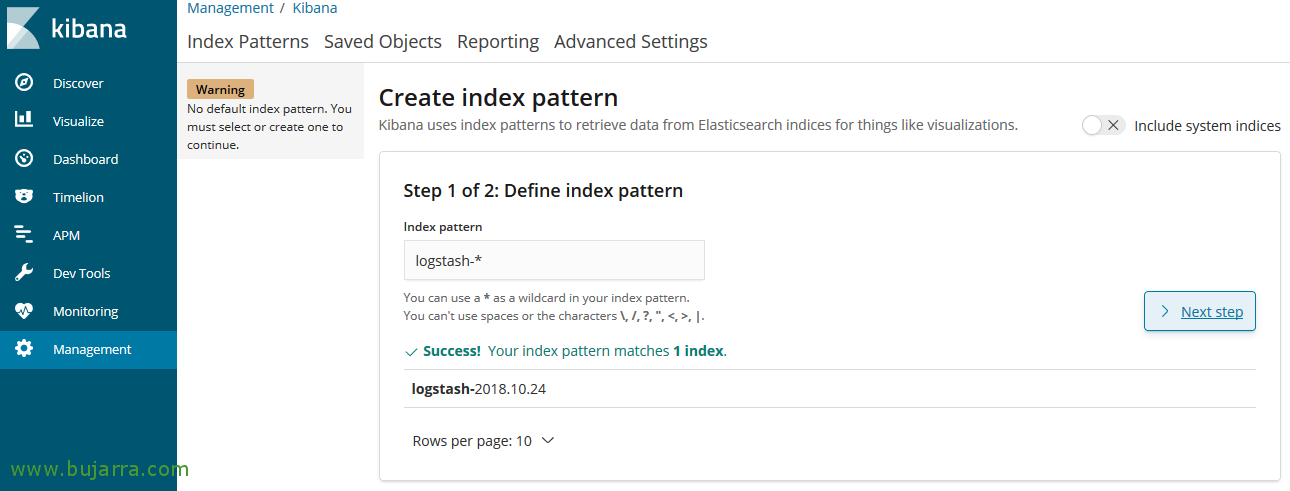
In Kibana, since “Management” > “Index Patterns” > “Create index pattern”, In the pattern we specify 'logstash-*', and we continue with the assistant.

Select the @timestamp field as for the timed filter, “Create index pattern”,
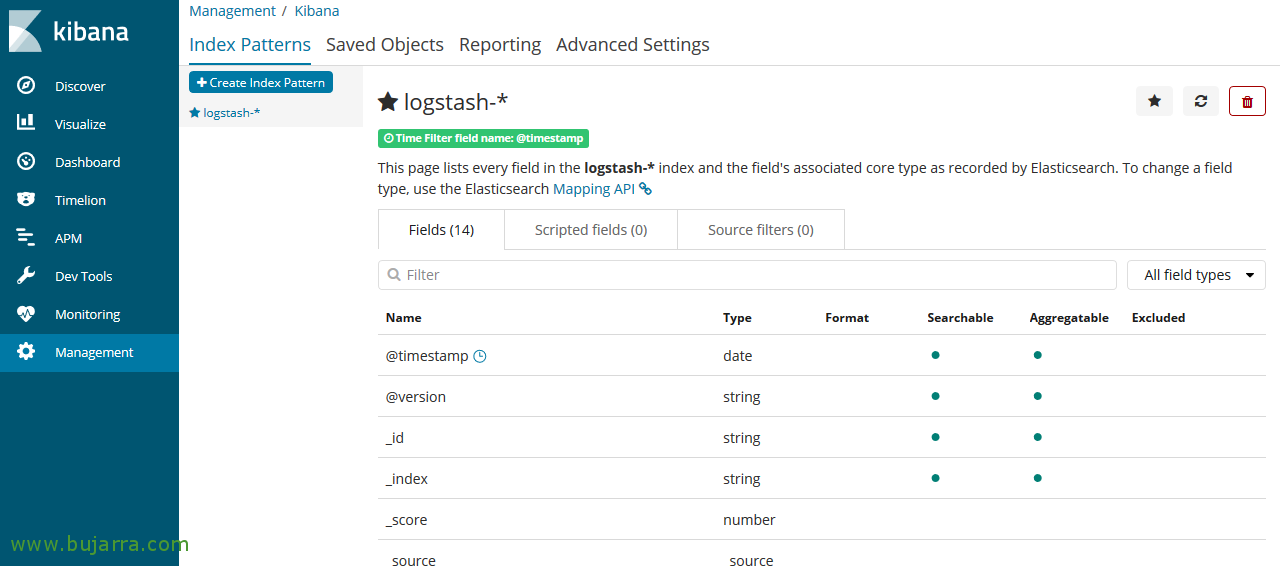
We have already created the index pattern, we will be able to see its fields and its type 🙂
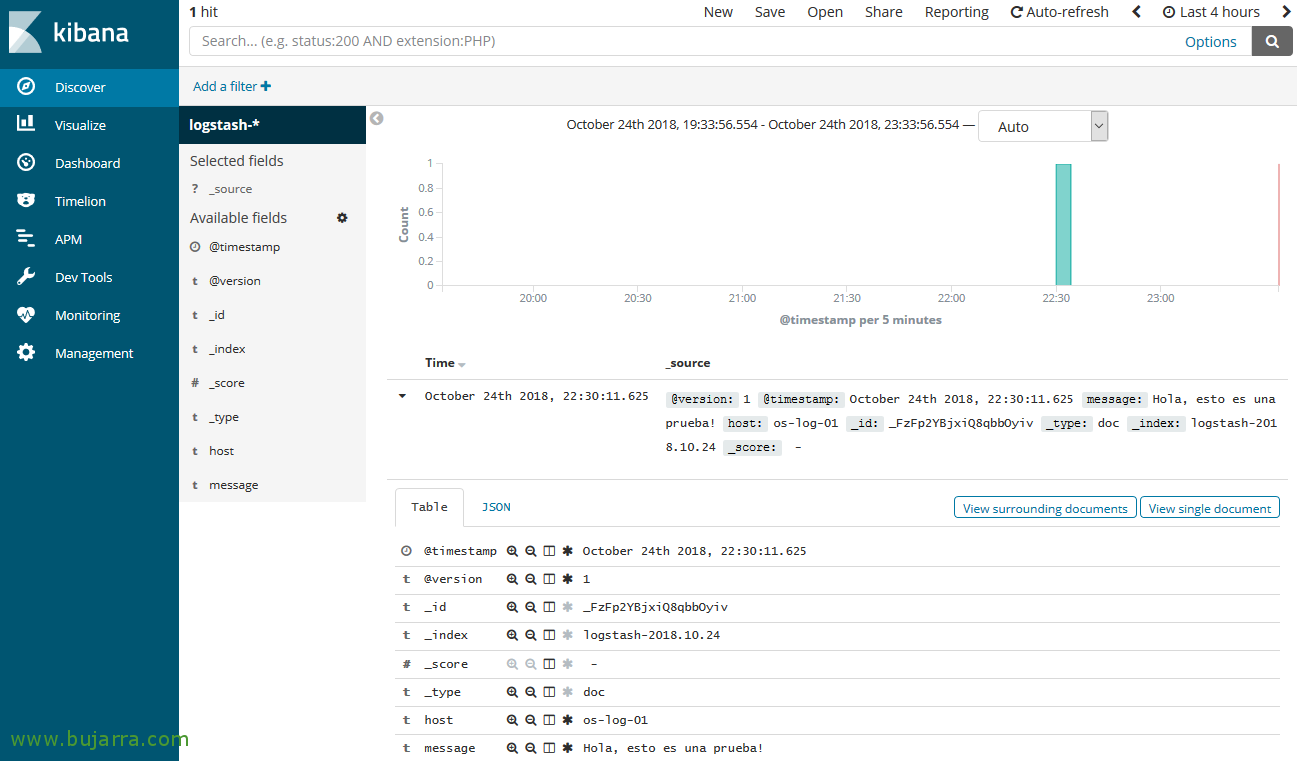
Now, There is nothing left to do but go to “Discover”, Select our index and play with the dates and we will be able to view all the information we have stored! If everything has gone well, we will have a single record with the example we did before!!