Monitoring the SLA of Hosts in Centreon

We will use this document to learn about the % availability of the machines monitored at Centreon. If we have an SLA (Service Level Agreement) What to comply with, we will be able to measure it from Centreon as well as alert us. Oh, and if you use Grafana, we'll see it from there too!
What I said, at the end of this post you will know how to measure the SLA offered by each machine you have monitored, we will associate a Service with each Centreon Host to know the availability offered by said machine. This way you will also have their history and if you are interested you could receive alerts when the % is less than the value you are interested in. And in the end that, if you use Grafana to visualize your Centreon monitoring, I'll tell you how I visualize that data, in case it brings you something 🙂
By the way, You're still interested, in This post We saw something similar, we saw how to get the SLA from Centreon Services. Today the Hosts play.
In order to measure the SLA, we will need to consult Centreon's own database, which is based on MariaDB (or MySQL), So if you don't have it, Before you need Review this post to be able to query any MySQL database.
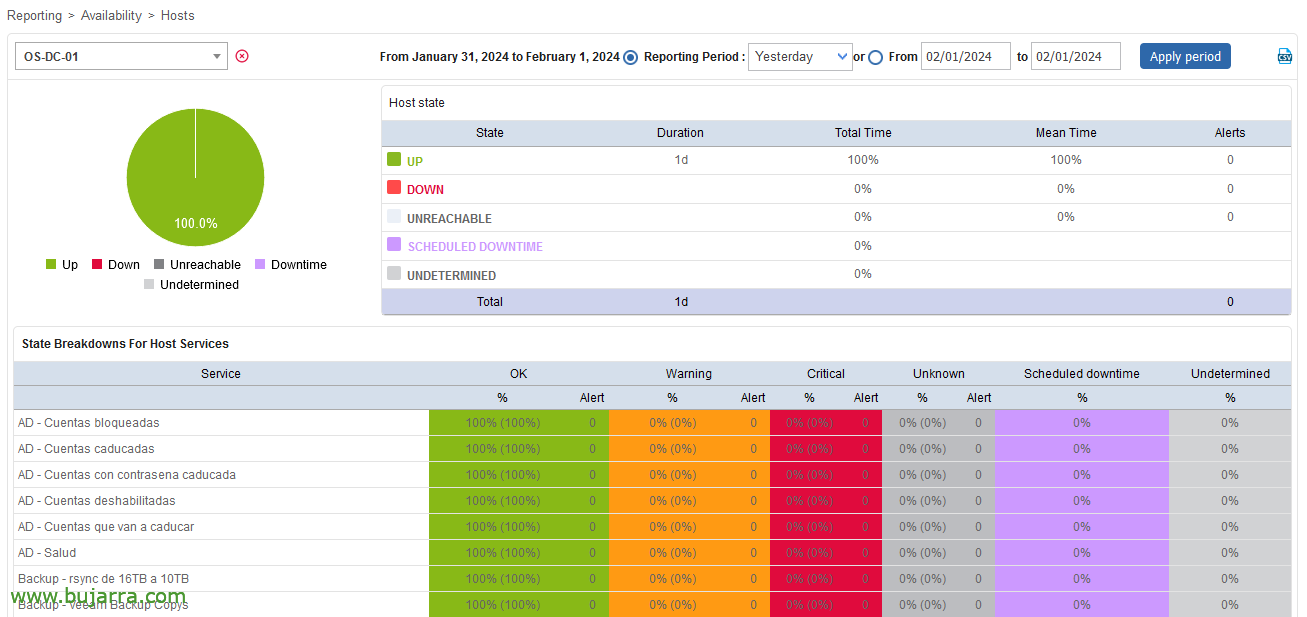
Anyway, remember that in Centreon the SLA can be viewed by GUI from “Reporting” > “Availability” > “Hosts”. We will obtain those same values, But we will monitor them, That's what's important!

We start! As always we will start with the Command, once we define this first Command, We can use it as many times as we need. Specifically, this command will give us the % that a machine has been in OK status, the % of time that has been good. As arguments he carries (i) the days you want to look back to calculate the SLA, 1 day, 7 days, 30 days, 365 days… (Ii) The name of the machine, that I could have really taken it with a Centreon variable and not asked, (Iii) the value you want from Warning, and (Iv) the one from Critical, So that I alert you, Less than these values will be considered an alert. I leave you the Command:
$CENTREONPLUGINS$/Nagios-Plugins/check_mysql_query.pl -q "SELECT ROUND((SUM(UPTimeScheduled)/($ARG1$ * 86400))*100,2) as percentage FROM hosts, log_archive_host WHERE log_archive_host.host_id = hosts.host_id AND hosts.name = '$ARG2$' AND from_unixtime(date_end) > date_sub(now(), INTERVAL $ARG 1$ day) order BY date_end DESC" -H DIRECCION_IP_CENTREON_CENTRAL -d centreon_storage -u 'USUARIO_MYSQL' -p 'CONTRASEÑA_MYSQL' -t 60 --no-querytime -g -l 'SLA' -U % -w $ARG 3$: -c $ARG$4: -m 'El SLA es del' -n
If instead of % You want to see how long it's been up, We can change the query to something like this:
$CENTREONPLUGINS$/Nagios-Plugins/check_mysql_query.pl -q "SELECT CONCAT(FLOOR(HOUR(sec_to_time(SUM(UPTimeScheduled))) / 24), 'd_', MOD(HOUR(sec_to_time(SUM(UPTimeScheduled))), 24), 'h_', MINUTE(sec_to_time(SUM(UPTimeScheduled))), 'm') AS Tiempo FROM hosts, log_archive_host WHERE log_archive_host.host_id = hosts.host_id AND hosts.name = '$ARG2$' AND from_unixtime(date_end) > date_sub(now(), INTERVAL $ARG 1$ day) order BY date_end DESC" -H DIRECCION_IP_CENTREON_CENTRAL -d centreon_storage -u 'USUARIO_MYSQL' -p 'CONTRASEÑA_MYSQL' -t 60 --no-querytime -T -g -l 'SLA'
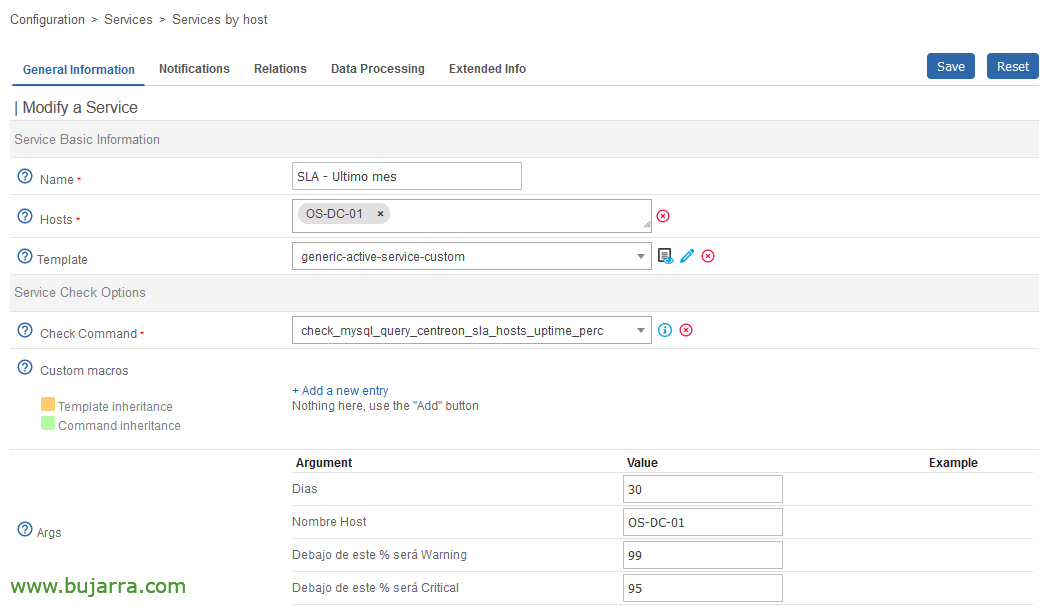
Once the Command is created, we could already create as many Services as we need and associate them with our Hosts, this example will show us the SLA of the last month of this machine, will give us Warning when the SLA is less than 99% and will send Critical message when it is less than 95%.
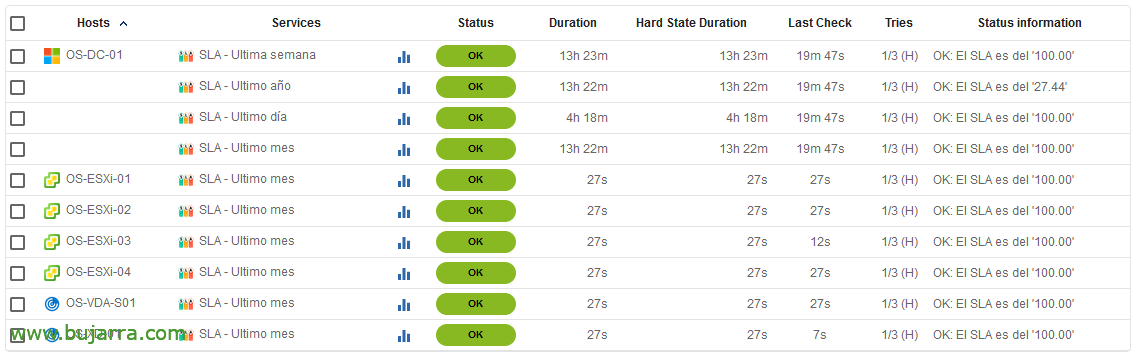
After recording and exporting your Centreon settings, we will be able to see the results. In a moment we can control the SLA of each device, Measure and improve it, or use it when requested. Keep in mind that this script should not be executed before 6am since Centreon internally in the database has not generated the data for that day and may give us somewhat falsified information, so the best thing to do is to put a particular program on it.
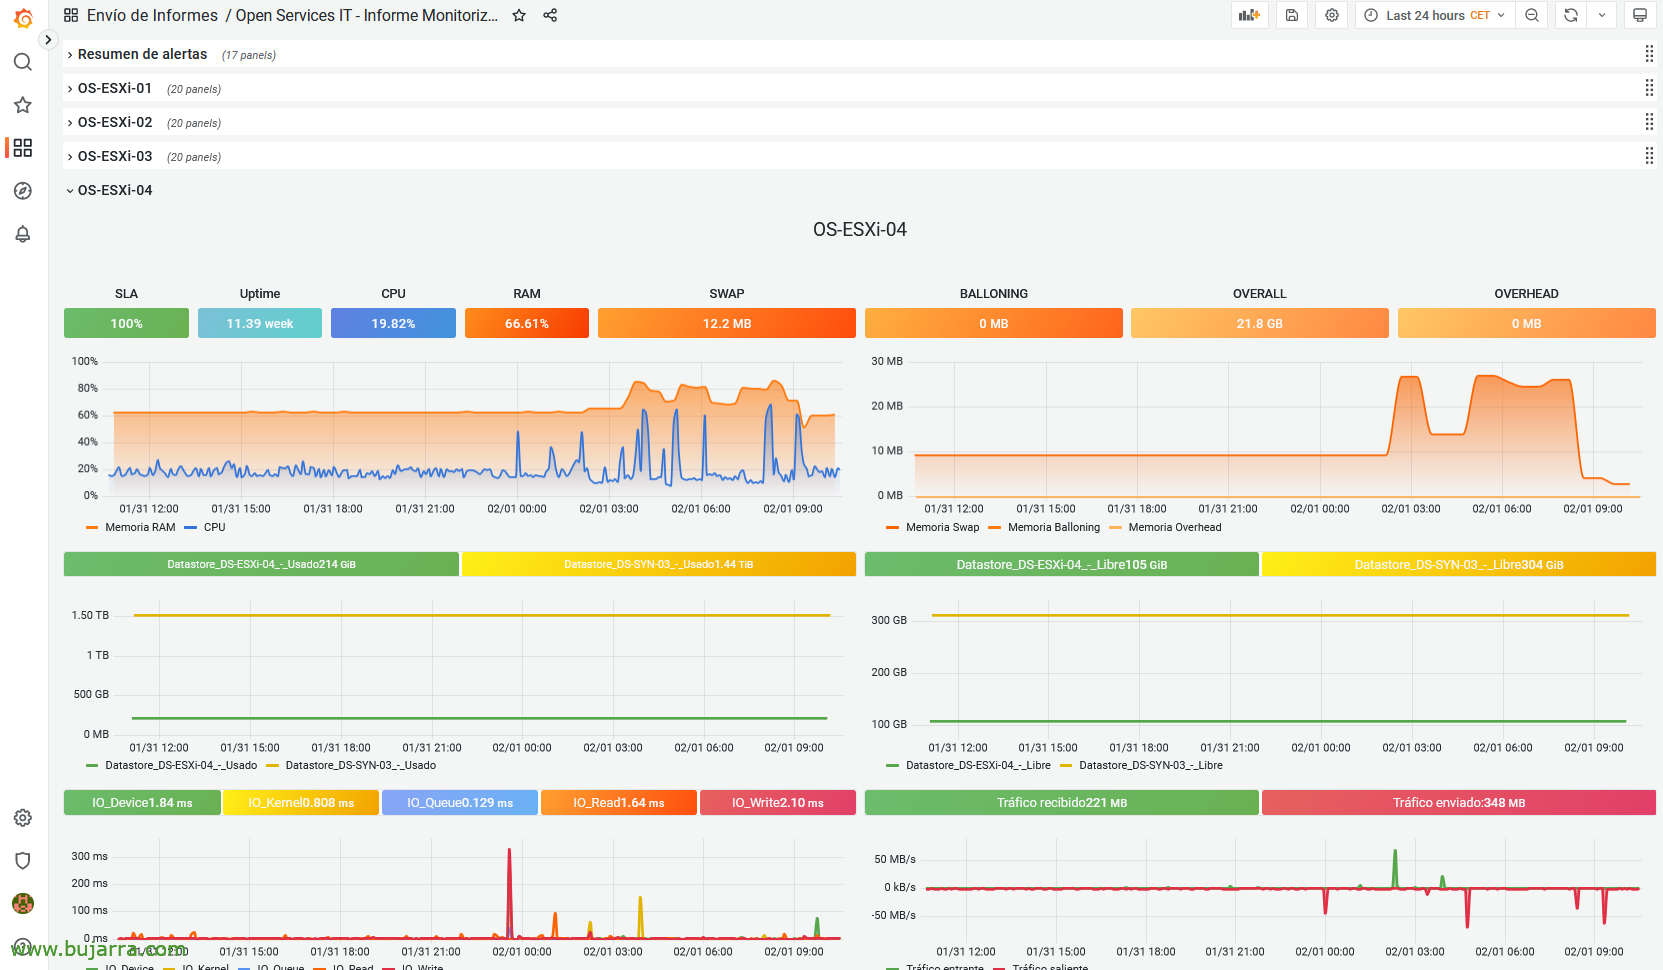
And if you have Grafana and you see monitoring data, we can calculate the SLA based on the time period of the graph, for this, If you look, there is a panel where you see the SLA.
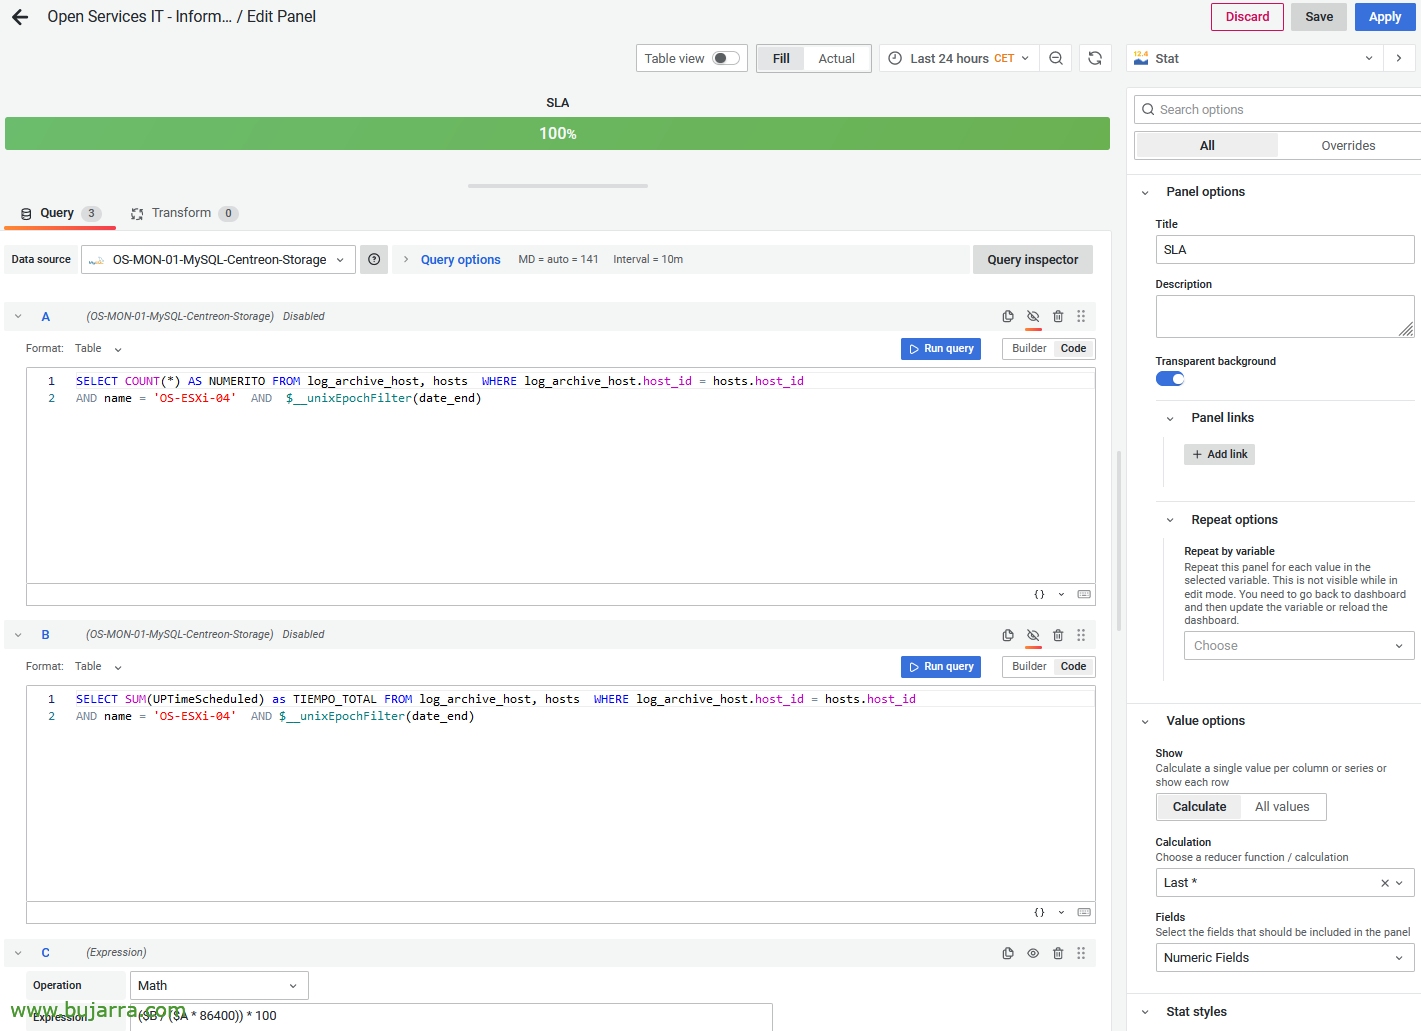
If we edit the 'statistics' panel, I calculate the SLA by obtaining it from 2 Consultations, The first one will get the days of the query (based on what is selected in Grafana, 24h, 1 month…); and the second obtains in seconds how long the computer has been in OK status. If you look at both queries they are hidden, and there's a third query that's of a mathematical type and gets the % based on these two values. I leave you the 2 Used Queries:
SELECT COUNT(*) AS NUMERITO FROM log_archive_host, hosts WHERE log_archive_host.host_id = hosts.host_id AND name = 'NOMBRE_DE_HOST' AND $__unixEpochFilter(date_end)
SELECT SUM(UPTimeScheduled) as TIEMPO_TOTAL FROM log_archive_host, hosts WHERE log_archive_host.host_id = hosts.host_id AND name = 'NOMBRE_DE_HOST' AND $__unixEpochFilter(date_end)
($B / ($To * 86400)) * 100
This way we will be able to see and demonstrate the SLA that we meet for each machine that offers services in our organization, I remind you that before I put a link to measure the SLA of the services, that depending on what we need would be the other option.
I hope as always that it goes very well, to take care of yourselves and I send you a hug!