
Monitoring the SLA of Centreon's Checked Services

Something curious and that depending on the circumstances may come in handy may be to know the SLA of any service that we are currently monitoring in our Centreons. It can also be designed for when we monitor at the Business level, to give visibility into your availability.

As we know, Centreon stores its metrics and statuses in a MariaDB database, we can simply by means of MySQL queries get it in time or in % the status of a monitored service in Centreon. We will be able to know how long (or percentage) has been in OK status, Warning, Critical, Unknown or in Maintenance. ¿For what? Well, It is well known that we can know the SLA of any Host or Service in Centreon, but it is another thing to monitor it to alert us when it is not fulfilled, or for example to view them in our Business Service via NagVis.
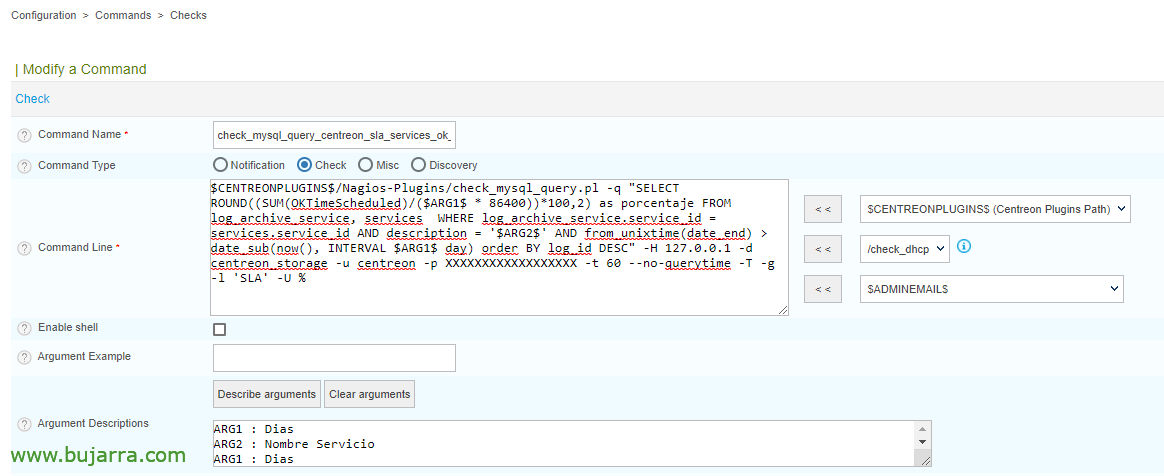
GOOD, to begin with, it would be interesting that if you are not monitoring MySQL queries, Check out This post. When you already have the script that allows you to query MySQL databases, we will be able to create the Commands we need and each one with its type of query. Since some commands will help us to monitor the SLA of Hosts, Other Services, others will give us the result in time and others in %, So depending on what you need, I leave you here certain possibilities:
- SLA of OK Services in %:
$CENTREONPLUGINS$/Nagios-Plugins/check_mysql_query.pl -q "SELECT ROUND((SUM(OKTimeScheduled)/($ARG1$ * 86400))*100,2) as percentage FROM log_archive_service, services WHERE log_archive_service.service_id = services.service_id AND description = '$ARG2$' AND from_unixtime(date_end) > date_sub(now(), INTERVAL $ARG 1$ day) order BY log_id DESC" -H 127.0.0.1 -d centreon_storage -u centreon -p CONTRASEÑA_USUARIO_CENTREON -t 60 --no-querytime -T -g -l 'SLA' -U %
- OK Services SLA in Time:
$CENTREONPLUGINS$/Nagios-Plugins/check_mysql_query.pl -q "SELECT CONCAT(FLOOR(HOUR(sec_to_time(SUM(OKTimeScheduled))) / 24), 'd_', MOD(HOUR(sec_to_time(SUM(OKTimeScheduled))), 24), 'h_', MINUTE(sec_to_time(SUM(OKTimeScheduled))), 'm') AS Weather FROM log_archive_service, services WHERE log_archive_service.service_id = services.service_id AND description = '$ARG2$' AND from_unixtime(date_end) > date_sub(now(), INTERVAL $ARG 1$ day) order BY log_id DESC" -H 127.0.0.1 -d centreon_storage -u centreon -p CONTRASEÑA_USUARIO_CENTREON -t 60 --no-querytime -T -g -l 'SLA'
- SLA Services Warning on %:
$CENTREONPLUGINS$/Nagios-Plugins/check_mysql_query.pl -q "SELECT ROUND((SUM(WARNINGTimeScheduled)/($ARG1$ * 86400))*100,2) as percentage FROM log_archive_service, services WHERE log_archive_service.service_id = services.service_id AND description = '$ARG2$' AND from_unixtime(date_end) > date_sub(now(), INTERVAL $ARG 1$ day) order BY log_id DESC" -H 127.0.0.1 -d centreon_storage -u centreon -p CONTRASEÑA_USUARIO_CENTREON -t 60 --no-querytime -T -g -l 'SLA' -U %
- SLA Services Warning in Time:
$CENTREONPLUGINS$/Nagios-Plugins/check_mysql_query.pl -q "SELECT CONCAT(FLOOR(HOUR(sec_to_time(SUM(WARNINGTimeScheduled))) / 24), 'd_', MOD(HOUR(sec_to_time(SUM(WARNINGTimeScheduled))), 24), 'h_', MINUTE(sec_to_time(SUM(WARNINGTimeScheduled))), 'm') AS Weather FROM log_archive_service, services WHERE log_archive_service.service_id = services.service_id AND description = '$ARG2$' AND from_unixtime(date_end) > date_sub(now(), INTERVAL $ARG 1$ day) order BY log_id DESC" -H 127.0.0.1 -d centreon_storage -u centreon -p CONTRASEÑA_USUARIO_CENTREON -t 60 --no-querytime -T -g -l 'SLA'
- Critical Services SLA at %:
$CENTREONPLUGINS$/Nagios-Plugins/check_mysql_query.pl -q "SELECT ROUND((SUM(CRITICALTimeScheduled)/($ARG1$ * 86400))*100,2) as percentage FROM log_archive_service, services WHERE log_archive_service.service_id = services.service_id AND description = '$ARG2$' AND from_unixtime(date_end) > date_sub(now(), INTERVAL $ARG 1$ day) order BY log_id DESC" -H 127.0.0.1 -d centreon_storage -u centreon -p CONTRASEÑA_USUARIO_CENTREON -t 60 --no-querytime -T -g -l 'SLA' -U %
- Critical Services SLA in Time:
$CENTREONPLUGINS$/Nagios-Plugins/check_mysql_query.pl -q "SELECT CONCAT(FLOOR(HOUR(sec_to_time(SUM(CRITICALTimeScheduled))) / 24), 'd_', MOD(HOUR(sec_to_time(SUM(CRITICALTimeScheduled))), 24), 'h_', MINUTE(sec_to_time(SUM(CRITICALTimeScheduled))), 'm') AS Weather FROM log_archive_service, services WHERE log_archive_service.service_id = services.service_id AND description = '$ARG2$' AND from_unixtime(date_end) > date_sub(now(), INTERVAL $ARG 1$ day) order BY log_id DESC" -H 127.0.0.1 -d centreon_storage -u centreon -p CONTRASEÑA_USUARIO_CENTREON -t 60 --no-querytime -T -g -l 'SLA'
- Hosts Uptime SLA on %:
$CENTREONPLUGINS$/Nagios-Plugins/check_mysql_query.pl -q "SELECT ROUND((SUM(UPTimeScheduled)/($ARG1$ * 86400))*100,2) as percentage FROM hosts, log_archive_host WHERE log_archive_host.host_id = hosts.host_id AND hosts.name = '$ARG2$' AND from_unixtime(date_end) > date_sub(now(), INTERVAL $ARG 1$ day) order BY date_end DESC" -H 127.0.0.1 -d centreon_storage -u centreon -p CONTRASEÑA_USUARIO_CENTREON -t 60 --no-querytime -T -g -l 'SLA' -U %
- Hosts Uptime SLA in Time:
$CENTREONPLUGINS$/Nagios-Plugins/check_mysql_query.pl -q "SELECT CONCAT(FLOOR(HOUR(sec_to_time(SUM(UPTimeScheduled))) / 24), 'd_', MOD(HOUR(sec_to_time(SUM(UPTimeScheduled))), 24), 'h_', MINUTE(sec_to_time(SUM(UPTimeScheduled))), 'm') AS Tiempo FROM hosts, log_archive_host WHERE log_archive_host.host_id = hosts.host_id AND hosts.name = '$ARG2$' AND from_unixtime(date_end) > date_sub(now(), INTERVAL $ARG 1$ day) order BY date_end DESC" -H 127.0.0.1 -d centreon_storage -u centreon -p CONTRASEÑA_USUARIO_CENTREON -t 60 --no-querytime -T -g -l 'SLA'
- Hosts Downtime SLA in %:
$CENTREONPLUGINS$/Nagios-Plugins/check_mysql_query.pl -q "SELECT ROUND((SUM(DOWNTimeScheduled)/($ARG1$ * 86400))*100,2) as percentage FROM hosts, log_archive_host WHERE log_archive_host.host_id = hosts.host_id AND hosts.name = '$ARG2$' AND from_unixtime(date_end) > date_sub(now(), INTERVAL $ARG 1$ day) order BY date_end DESC" -H 127.0.0.1 -d centreon_storage -u centreon -p CONTRASEÑA_USUARIO_CENTREON -t 60 --no-querytime -T -g -l 'SLA' -U %
- SLA de Hosts Downtime en Tiempo:
$CENTREONPLUGINS$/Nagios-Plugins/check_mysql_query.pl -q "SELECT CONCAT(FLOOR(HOUR(sec_to_time(SUM(DOWNTimeScheduled))) / 24), 'd_', MOD(HOUR(sec_to_time(SUM(DOWNTimeScheduled))), 24), 'h_', MINUTE(sec_to_time(SUM(DOWNTimeScheduled))), 'm') AS Tiempo FROM hosts, log_archive_host WHERE log_archive_host.host_id = hosts.host_id AND hosts.name = '$ARG2$' AND from_unixtime(date_end) > date_sub(now(), INTERVAL $ARG 1$ day) order BY date_end DESC" -H 127.0.0.1 -d centreon_storage -u centreon -p CONTRASEÑA_USUARIO_CENTREON -t 60 --no-querytime -T -g -l 'SLA'
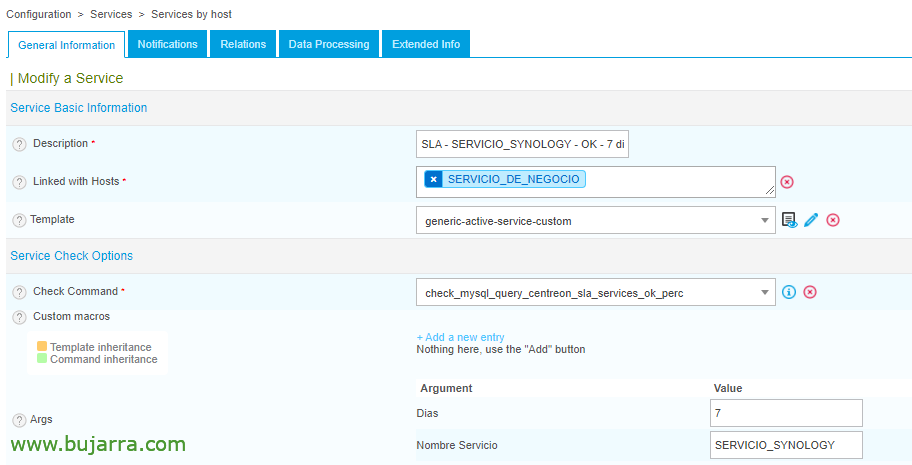
And now we just need to create as many Services to monitor the SLA as we are interested in, In this case study, I'm using them only to measure the SLA of the Business Services, and therefore to view them in NagVis. As arguments we will put the days of the SLA that we are interested in seeing and in the Name of the Service, the unique name of a Service to be checked.

And as always, After recording and exporting the settings, we will have our SLA services ready to check through a query in the Centreon database the time or percentage of the status of a Service.
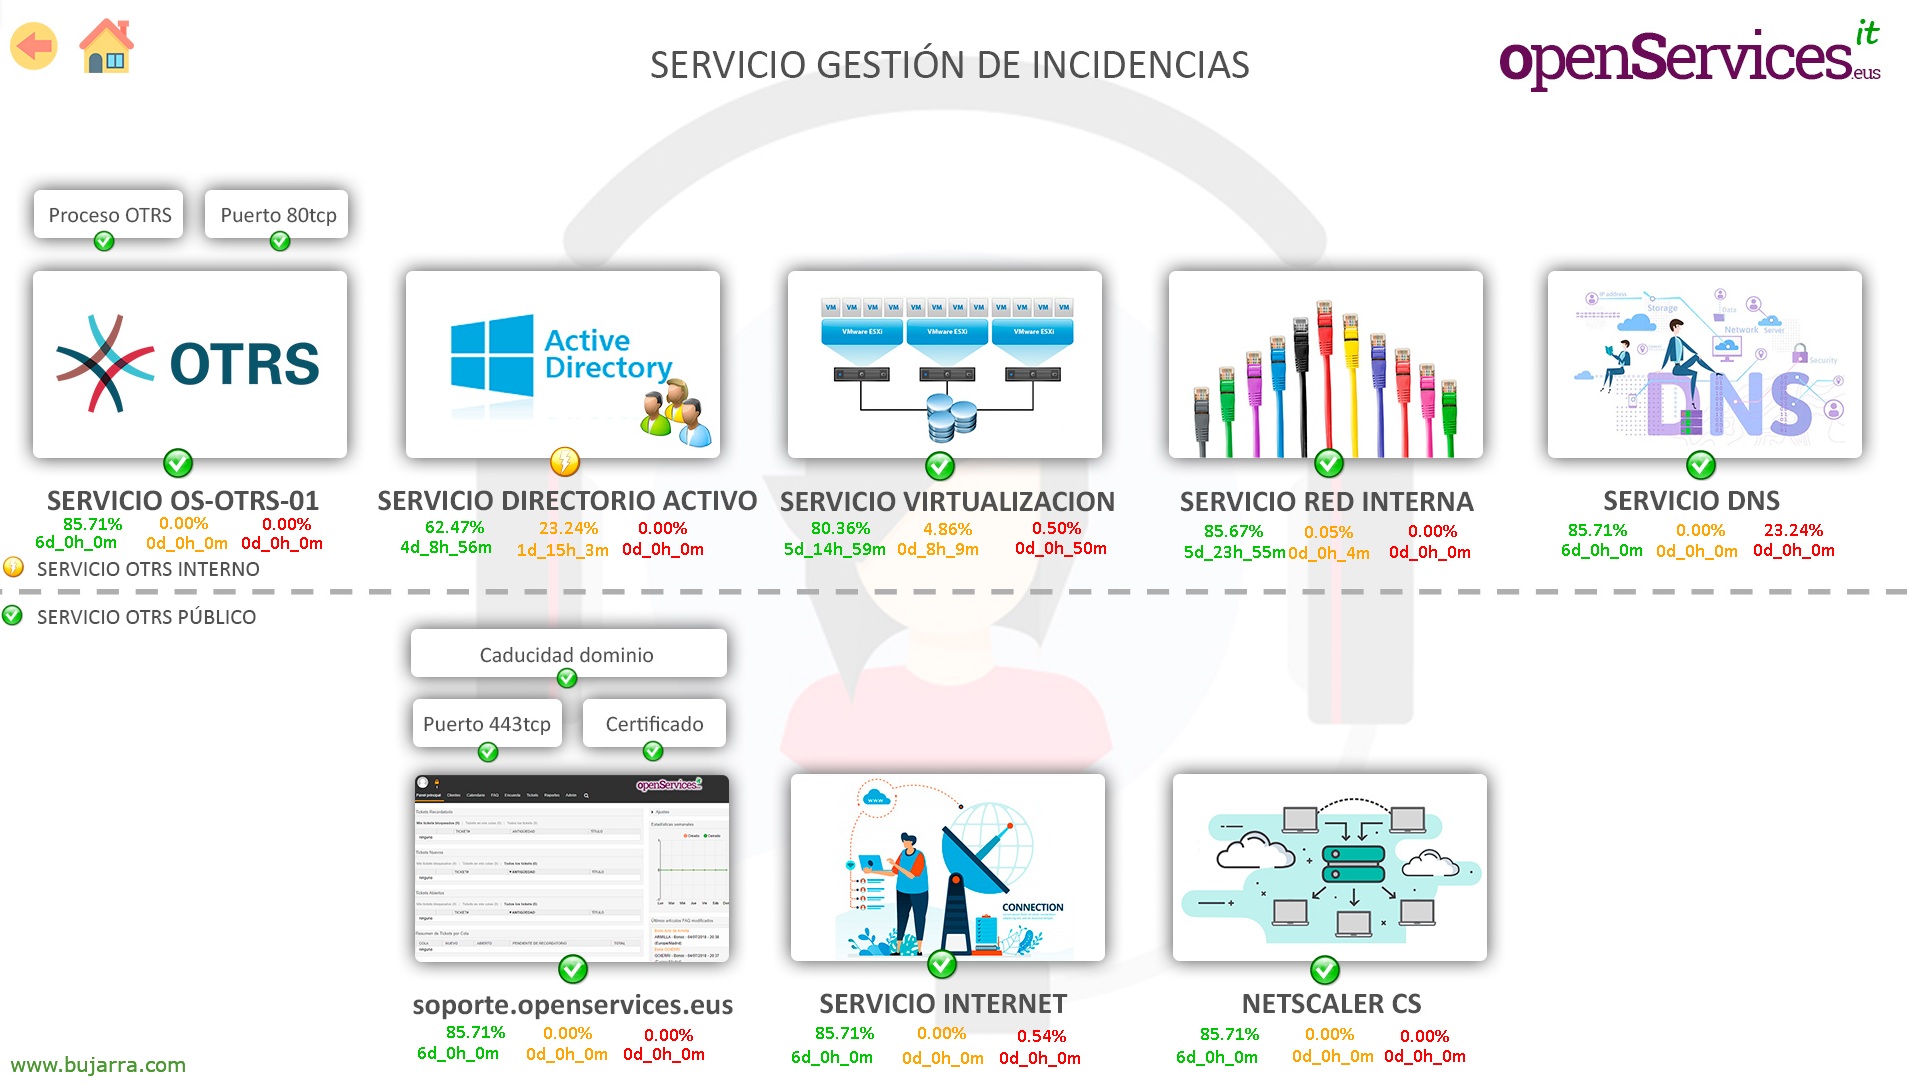
And in NagVis, with the RawNumbers Gadget we will be able to add the monitored SLA items and it will be more attractive when moving between maps and knowing the SLA offered by any service, Ideal for non- 100% technicians and want to know the status of their infrastructure in real time.