Monitoring an HP MSA Array

We continue with more things that we can monitor with Nagios or Centreon! If we have an HP MSA storage array in our organization, either fiber or iSCSI, This is your document! In a simple way, we can absorb the information that we are interested in controlling through SNMP, Be the state of the hard drives, The controllers, Volumes, RAID, Temperatures, Chassis Condition, Alerts, etc, etc…
GOOD, We'll use a couple of scripts in this document, although everyone is free to use the ones they want! We start with a generic one that will check with a single command all the health of the hardware, Check all sensors in the cabin. And then, We use another script that is wonderful and by passing different parameters we can see the items individually.
Generic Check – Hardware Status,
We will need to download this script, check_msa_hardware.pl, of the magnificent Exchange Nagios website (as usual), since: https://exchange.nagios.org/directory/Plugins/Hardware/Storage-Systems/SAN-and-NAS/Check-HP-MSA-(Modular-Smart-Array)-sensors/details. This script will be used to monitor any HP MSA2312i or HP MSA2012i or HP MSA2012fc or HP MSA2324i or HP P2000 G3 MSA!!!!
First of all, Before you go any further, will be to enter the MSA controllers and enable SNMP, indicating a trusted community. And then, after downloading the script and leaving it in the Centreon scripts folder '/usr/lib/centreon/plugins', In my case I save them in '/usr/lib/nagios/plugins', We will also make it executable as usual ('chmod +x check_msa_hardware.pl')! And we will be able to test it from shell, using the following command:
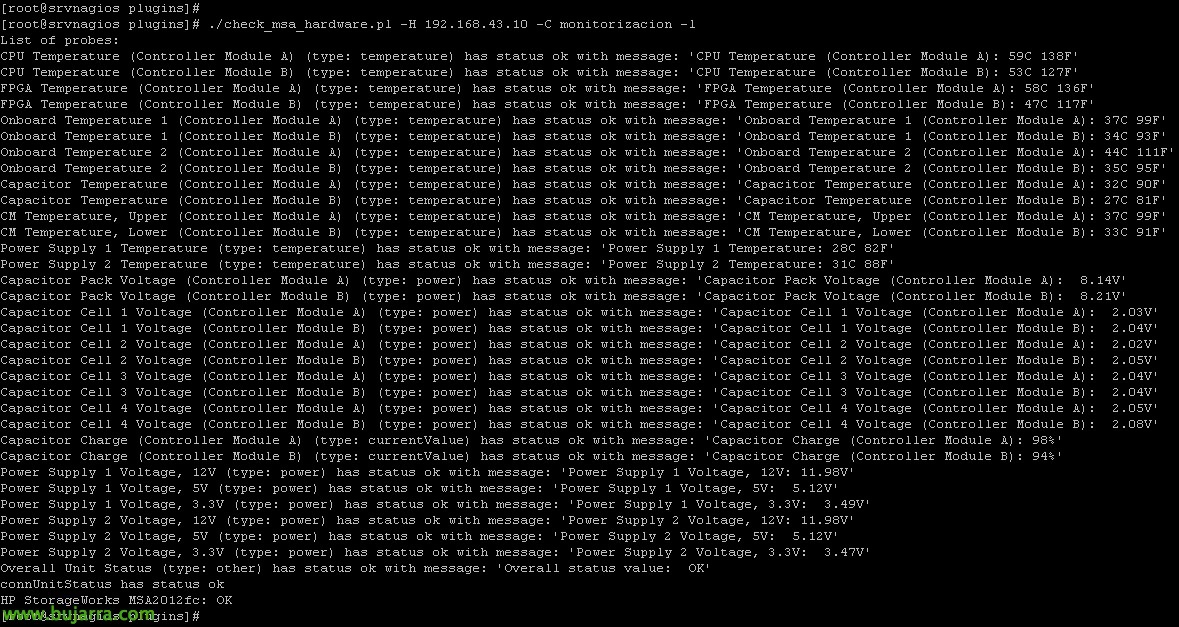
[SourceCode]./check_msa_hardware.pl -H DIRECCION_IP_CONTROLADORA -C COMUNIDAD_SNMP -L[/SourceCode]
With that command, as we will see, it will list all the possibilities that the MSA in question will give us, all control over CPU temperature sensors, chassis, Controllers, Power supply status… We go all out. We can use this script to create a monitoring service from Centreon that we can call 'Hardware Status'’ or something similar, since this same script as we see will check all the items in each cabin.
Therefore, this is what we will do next, we will create the cabin team in Centreon to be able to monitor it, to add it later and the monitoring services that interest us. We'll start with the generic script we just saw and then we see another script that allows us to granularly monitor each item that we're interested in seeing in the monitoring. So as always, We create the host to monitor, We will create the command associated with the script and then the services on top of this command. To monitor what interests us, Step by step!
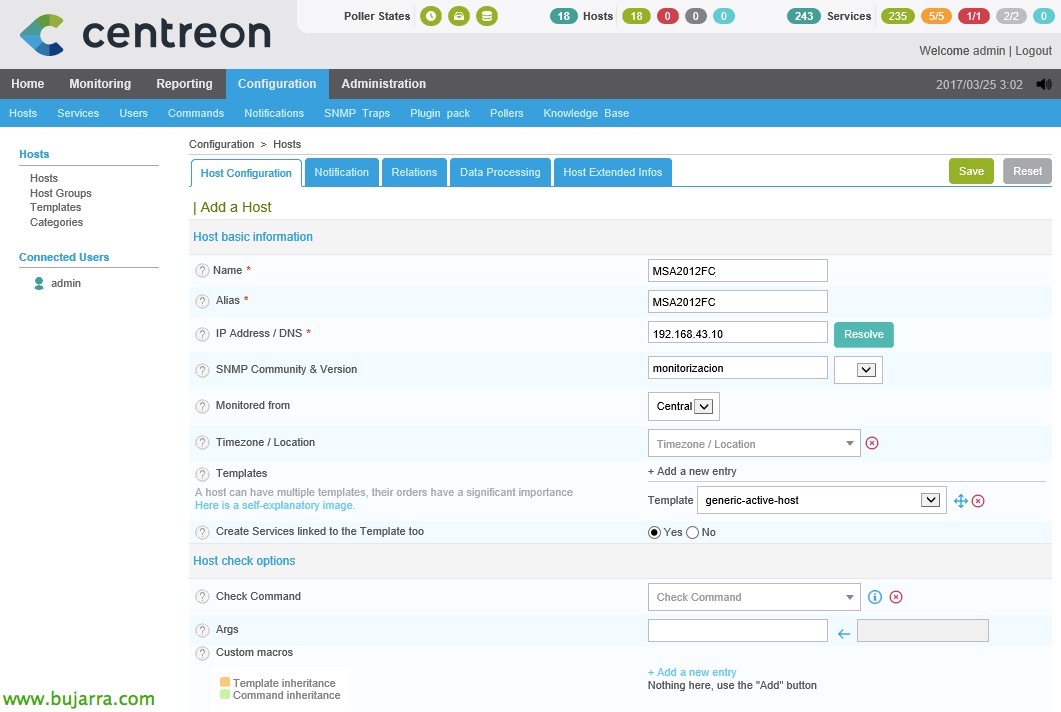
As usual, if we do not have the cabin defined in our Centreon we will have to register it as we know, “Configuration” > “Hosts” > “Add…” and fill in the following data & click on 'Save':
- Name: We will indicate the name of the cabin and its controller, if you have more than one as usual.
- Alias: We indicate the alias with which we will see this computer in the monitoring, usually the same as the name.
- IP Address / DNS: IP address of the controller to be monitored. If we have more than one, We will repeat the creation of this host, No matter how many controllers we have, For example: CABINA_A, CABINA_B… and then the services that we'll create in this document, We'll link them to all the controllers we have, Or good, Everyone can do as they want 😉
- SNMP Community / Version: We indicate the SNMP community that we have established via GUI or CLI in our cockpit. Usually version 2.
- Monitored from: As usual, for now if we only have a central appliance from which to monitor, we have no choice but to select it. As we will see later, in large installations where we want to share the load, we can select another source to run these checks and not always the same Centron machine (o Nagios in each case). Or also in case we have a remote delegation and we want to reduce silly traffic.
- Templates & Create Services linked to the Template too: Select 'generic-active-host’ which is a generic pre-created template, where it will inherit the configs of that template, at least the Ping service, etc… And let us therefore indicate that we also believe the services that this staff may have.
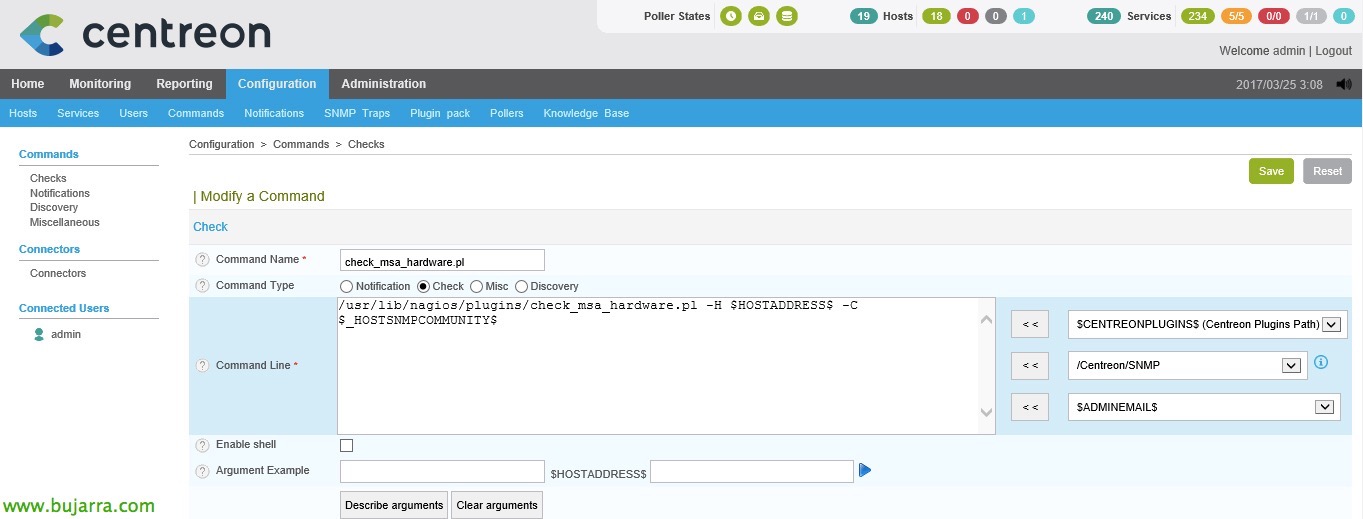
Following for Bingo, Once the host is created, We also need to create the command that will execute the script we have seen before. This is, We're going to “Configuration” > “Services” and we clone an existing one well where we already have 'things set up'’ as the times or whatever we want, We create a new one, to the consumer's taste. We indicate the following data at least:
- Command Namand: We give you a name, usually the same as the script to remember it better 😉
- Command Type: Check 'Check’
- Command Line: We put what this command will execute, therefore it will be enough to get the health of all the sensors in the cabin with '/usr/lib/nagios/plugins/check_msa_hardware.pl -h $HOSTADDRESS$ -C $_HOSTSNMPCOMMUNITY$'.
We can change other options, whether it's the type of charts you'll use, etc… Click on 'Save'.
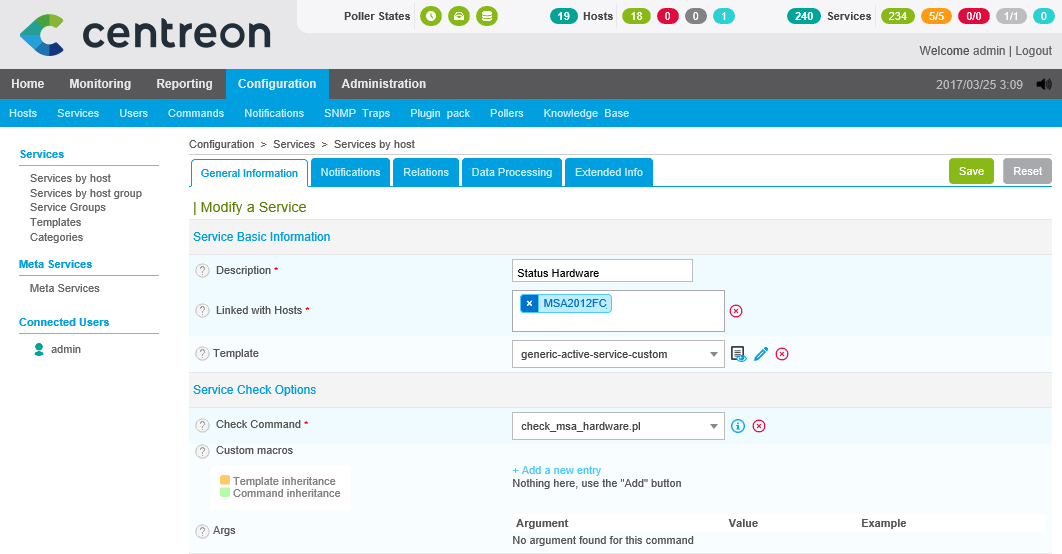
The latest already, Once we have the steps done; We can create a service that we will link to the previous command and associate it with the cockpit controllers. Since “Configuration” > “Services” > “Add…” to create it, or more comfortable, as usual, will be to clone an existing service and modify at least the following:
- Description: We indicate the name with which we will see the monitored service.
- Linked with Hosts: We bind this service to the hosts created that are the controllers of the MSA.
- Template: Select 'generic-active-service-custom'.
- Check Command: Select the newly defined command 'check_msa_hardware.pl'.
Checking each element of the cabin individually,
Well, As I said, if we want to see the status of the disks, chassis, harbours, Controller redundancy, FRUs, sensors or vdisks directly, We'll use this too. Thanks to the 'check_msa2012i_g1 script’ that we can get down from https://exchange.nagios.org/directory/Plugins/Hardware/Storage-Systems/SAN-and-NAS/Check-MSA-2012i-G1/details. What's different about this script is that it won't use SNMP, if you don't consult Telnet. We must first install the necessary requirements to make it work, from the shell of our monitoring appliance, Run:
[SourceCode]perl -MCPAN -e'shell’
Cpan> install Net::Telnet
Cpan> install XML::Simple[/SourceCode]
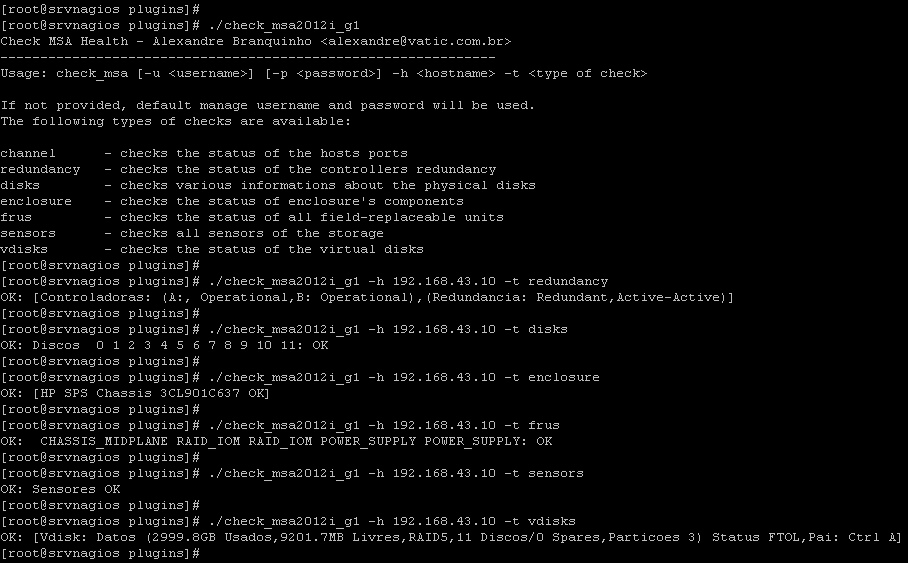
Once the requirements are completed, as usual, We download the script and upload it to the monitoring appliance, We leave it in the scripts folder, We will make it executable and test it. Using the following examples, We may collect different information:
[SourceCode]# Controller redundancy:
/usr/lib/nagios/plugins/check_msa2012i_g1 -h DIRECCION_IP -t redundancy
# Check the discs:
/usr/lib/nagios/plugins/check_msa2012i_g1 -h DIRECCION_IP -t disks
# Chassis Status:
/usr/lib/nagios/plugins/check_msa2012i_g1 -h DIRECCION_IP -t enclosure
# Controller redundancy:
/usr/lib/nagios/plugins/check_msa2012i_g1 -h DIRECCION_IP -t frus
# Sensor status:
/usr/lib/nagios/plugins/check_msa2012i_g1 -h DIRECCION_IP -t sensors
# Vdisk Status
/usr/lib/nagios/plugins/check_msa2012i_g1 -h DIRECCION_IP -t vdisks[/SourceCode]
This script, like many others, If they give you problems, or they do not give all the information you expect, either because of obsolete OIDs or that we have to manually add more disks to monitor… Well, that's it, that he will have no choice but to modify them, or that, or look for other alternative scripts. Many times we will have to make our own! This script I remember just looking at the 4 first disks and a single vDisk, It is easy to find what needs to be modified in the script to achieve it 😉 For more help of the script you pass /h.
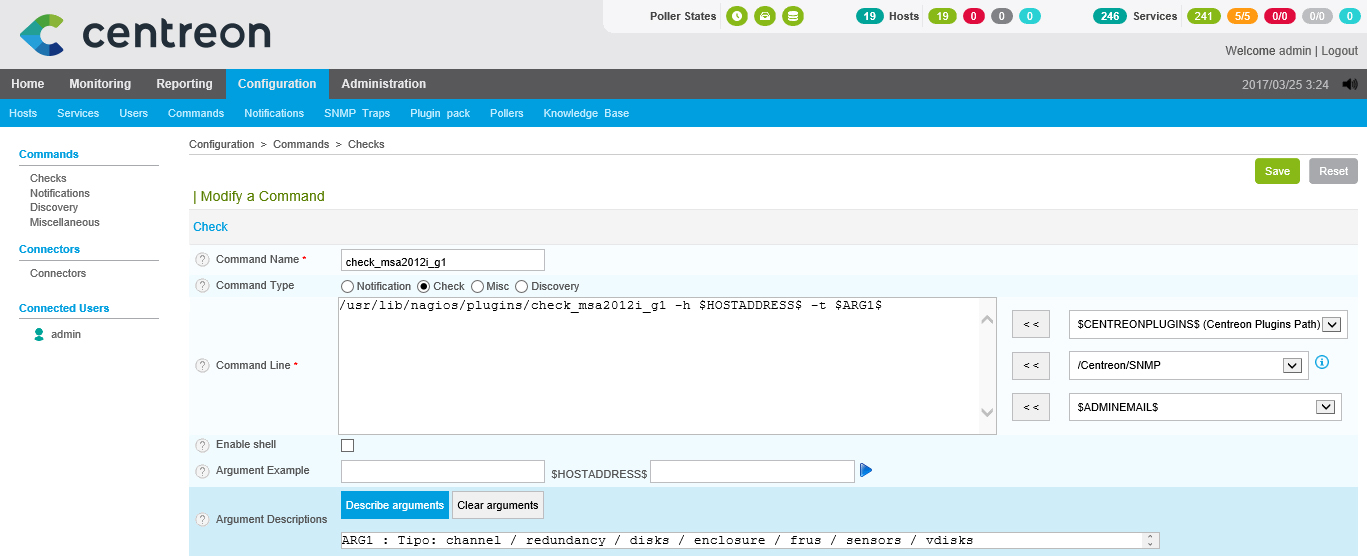
Once tested, ready! We go to Centreon and register the Command first, “Configuration” > “Services” and clone the command we created before (For example). We modify the following data at least:
- Command Name: Your name, As I said, I put the same as the script to remember it better 😉
- Command Type: Check 'Check’
- Command Line: What this command will execute, we'll use a variable argument that we'll pass to it from the Service, Staying: '/usr/lib/nagios/plugins/check_msa2012i_g1 -h $HOSTADDRESS$ -t $ARG 1$’
We recorded with 'Save',
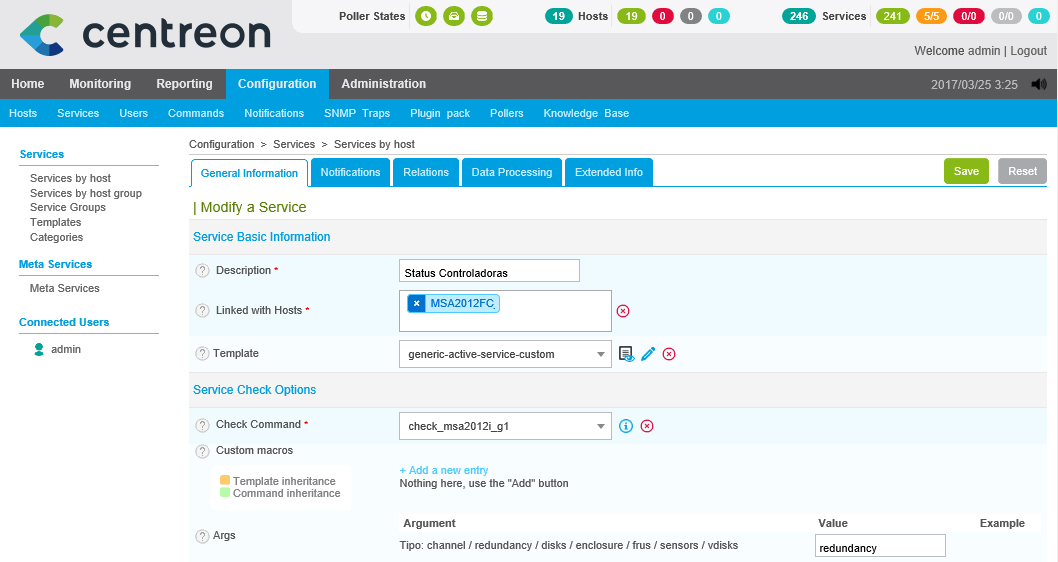
And nothing, We are creating all the services, We will create as many as we are interested in, changing the argument with the option that interests us, Since “Configuration” > “Services” > We clone the previous one we created or any other one and change:
- Description: Name with which we will see the monitored service.
- Linked with Hosts: We bind this service to the hosts created that are the controllers of the MSA.
- Template: Select 'generic-active-service-custom'.
- Check Command: Select the newly defined command 'check_msa2012i_g1'.
- Args: We indicate the argument that the script needs to get the information from the item we are interested in, we saw that they would be: Channel, redundancy, Disks, enclosure, Frus, sensors and vdisks.
We recorded with 'Save'.
Now, as usual, remember to export the data and reload the settings so that Centreon can read the new changes we just put in. I remind you, we'll go to "Configuration" > "Pollers" > "Export configuration", Selecting our poller, We mark the checks and restart & "Export".
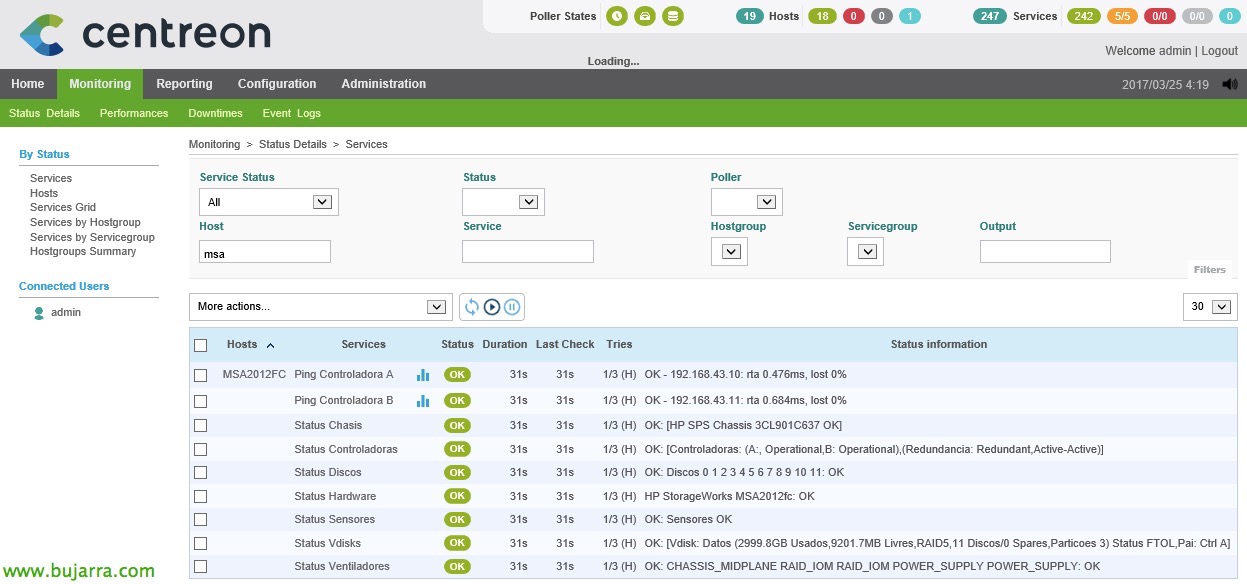
Once everything is generated, we can go to the monitoring part and check it! We'll look at all the new services we've created that monitor different things. Si queremos forzar el checkeo, ya sabemos, select the services that interest us and in the combo select 'Services – Schedule immediate check (Forced)’. With that, Already our beloved little monitoring appliance will control our delicate cabinets, How easy it is to sleep peacefully! Come on, we'll continue another day with more!!! Enjoy!
And by the way, if we need other checks, It's as easy as searching the Exchange Nagios What We Want!