Nagios – Monitoring Open Ports

Another very common and simple check at the same time is the monitoring of a TCP port if it is up and responds in an adequate time. In this document, We will see how to monitor the availability of some ports offered by our servers, are critical ports like 80TCP for our websites, 25TCP for Mail Servers…

GOOD, If we go down to the shell of our Nagios, although it is not necessary, We'll see that if we go to the Nagios plugins directory, We have a script called 'check_tcp’ which we can execute in the following way to test if a site or a server listens on that port:
[SourceCode]/usr/lib/nagios/plugins/check_tcp -H DIRECCION_IP_O_HOSTNAME -p PORT[/SourceCode]
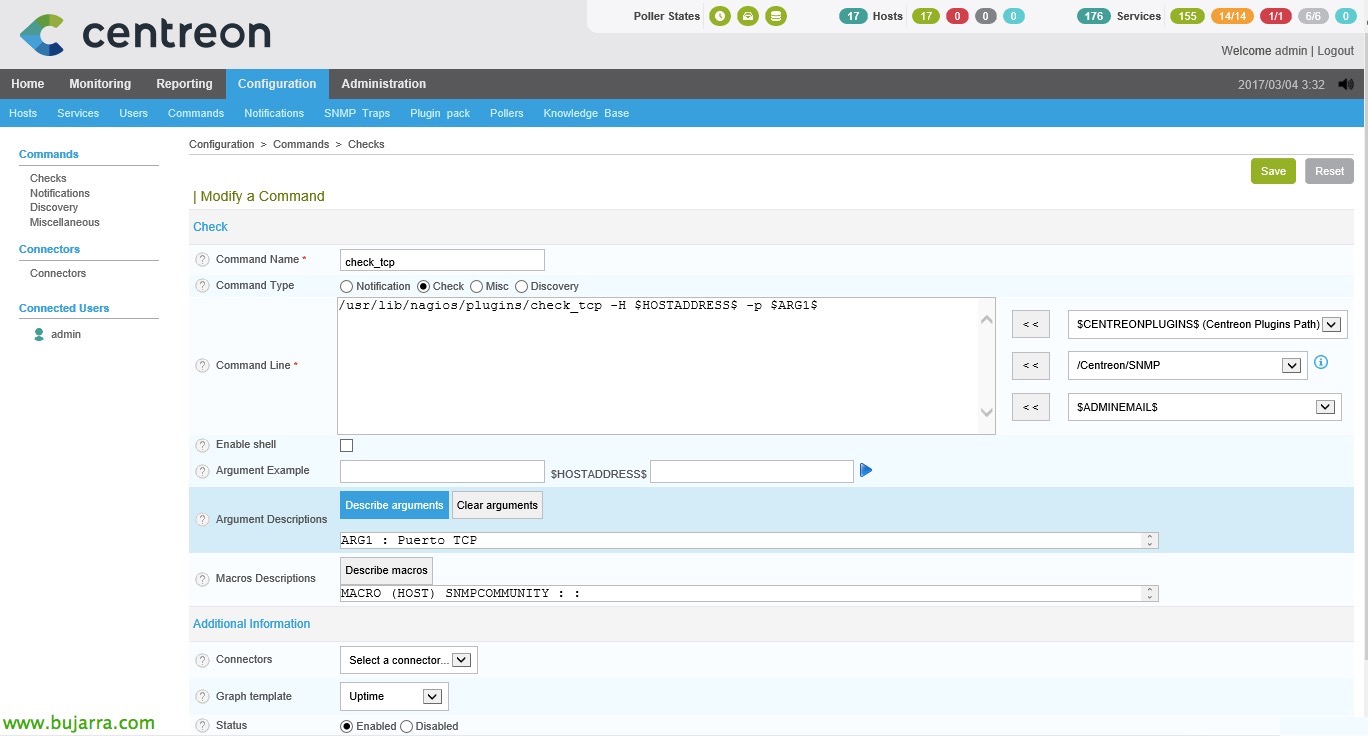
We start, from Centreon, we will have to create the Command if it does not exist, therefore, We're going to “Configuration” > “Commands” > “Add” or we clone an existing one and modify what is necessary as usual, Be the name, the command line that you will execute and when using arguments, We will not forget to describe them. The command line would look like this:
[SourceCode]/usr/lib/nagios/plugins/check_tcp -H $HOSTADDRESS$ -p $ARG 1$[/SourceCode]
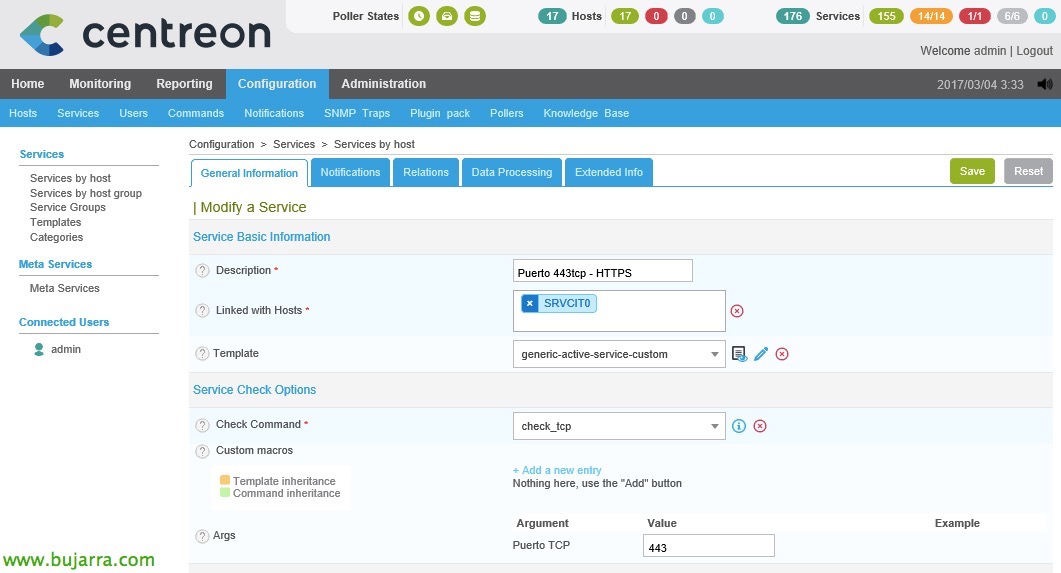
Once the Command is created, now we will have to create as many Services as we are interested in monitoring, in this example I will create a check of Port 443tcp HTTPS against certain machines that should respond to that port. “Configuration” > “Services” > “Add” or we clone an existing service and modify it with the following information:
- Description: The name as we will see in the monitoring of the analyzed service.
- Linked with Hosts: Which servers will we link this service to?.
- Template: generic-active-service-custom
- Check Command: The newly created check_tcp
- Argument: We fill in the argument with the number of the port to be checked.
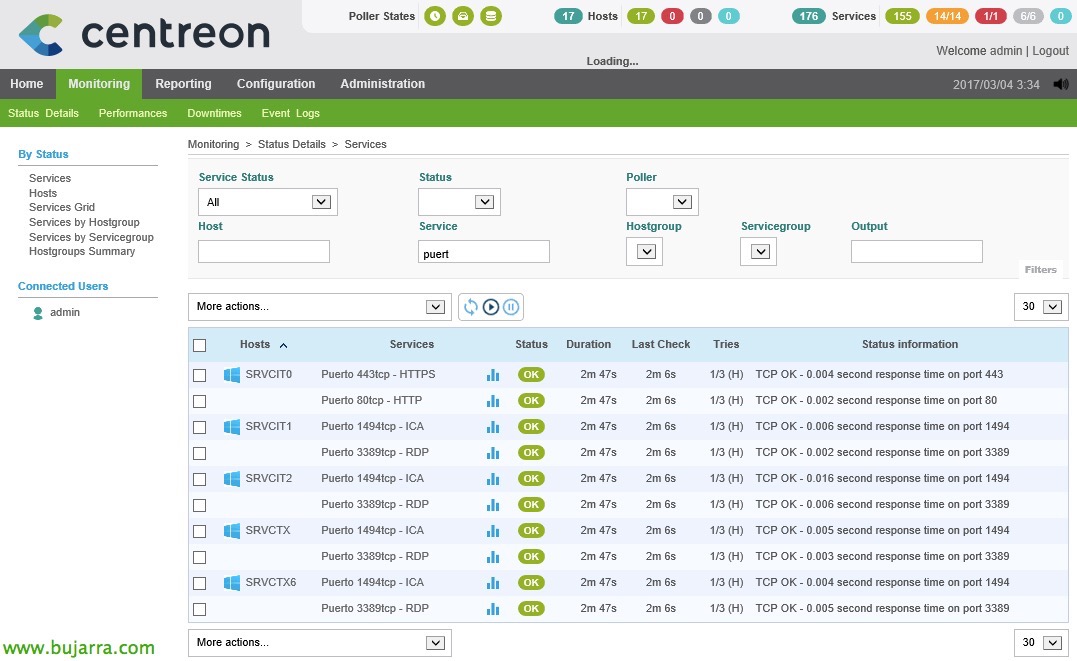
And that's it! If we record the Centreon configuration, We force a check of newly created services. Let's now see the status of the monitoring and we will see our ports being monitored! Very easy!!!