Nagios – Monitorizando servicios de los Windows

Once we have our Windows computers monitored, perhaps we are interested in monitoring something as critical as the services they offer, No? Also, through SNMP we will be able to consult if SQL services, Exchange or any other service that has your computer installed is up or down.
If you missed the post on how to monitor a Windows computer, whether server or desktop, Please review This document, how SNMP can get information from you!

To do this,, it will be as easy as creating the command and the service and then associating it with the Windows host. In the case of the, since “Configuration” > “Commands” > “Add” (Or we duplicate one). And we create the command with which Nagios must execute to monitor if the specific Windows service is up. We'll use the check_snmp_win.pl script that's in the Nagios plugin directory, It's very simple, It will be enough to pass it with '-n’ the name of the Windows service to be monitored, so we leave that as an Argument, thus leaving the 'Command Line':
[SourceCode]/usr/lib/nagios/plugins/check_snmp_win.pl -H $HOSTADDRESS$ -C $_HOSTSNMPCOMMUNITY$ -n $ARG 1$[/SourceCode]
Remember to hit “Describe arguments” to fill in the Argument 1 and put something like 'Windows Services'.
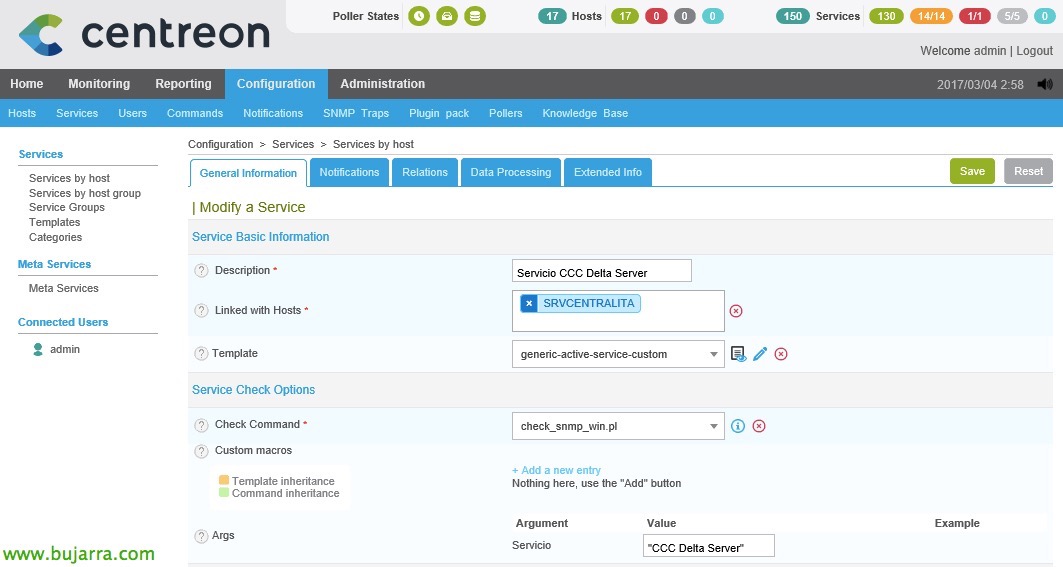
GOOD, Once the command is created, ya sabemos, let's go to the service and we will be able to create as many as we need to monitor all the services of our Windows computers. In this example I monitor a service called 'CCC Delta Server’ that is raised on a specific team, it will be enough to pass the name of the service in quotation marks with double quotation marks to the argument “. We will be able to separate with commas ',’ add more Windows services and bundle them all together. For example, SQL Services and we put the database service in there, Browser, Agent…
Important: If the service has any strange character, for example a parenthesis, or an accent among others, we can replace that command with a period'.’ and use it as a wild card, so we won't have strange mistakes!

And nothing, The usual, Once the services we need have been created, we can now save the configuration as usual. I summarize the steps because I know you know how to do it 😉 . It would be going to “Configuration” > “Pollers” > “Export configuration”, We check the checks to generate the configuration, Export files & restart the Engine service, We would press “Export”.
If we were to go back to the monitoring view, we would already see our Windows services checked, in the image you can see some monitored Citrix services. This has just begun!!! We will see more deeply another type of monitoring, All this is a good basis for having the organization somewhat monitored, But we still have a lot of work and a lot to customize.