Collecting Fortigate LOGs in Elasticsearch and Visualizing Them in Grafana
We continue with another document where we will try to centralize all our LOGs in Elasticsearch, this time it's our turn of Fortigate firewalls. The idea will not only be to collect the LOGs but also to understand them visually and have tools that help us in our day-to-day lives.
What I said, The objective is as follows, first collect the LOGs that we have in Fortigate's firewalls, to have them in one place, that will be our beloved Elasticsearch. Once we have the LOGs there we can use Kibana to gossip about what is happening, Who visits which website, which applications are the most used or what traffic they generate… and apart from browsing it, because the idea will also be to visualize it in Grafana, that we know that we have a lot of types of Panels to understand or make understand what we are recording in those LOGs.
We can make Cheese-type panels, Stalemate, Bar Graphs, of course Sankey type, or place a World Map and geolocate the IP addresses of Destination or Origin, and knowing who and when is accessing our resources, as well as our users for what they use the Internet for.
The most comfortable thing will be to do it from Kibana, there it will also indicate certain necessary steps that we will see below, from Kibana we go to its “Home” > “Add data” > “Fortinet logs”, The good thing is that this wizard will check if we have followed the steps right and it is collecting data, and it will create the index if everything is OK.
Installing Filebeat,
We have to install Filebeat on a Windows or Linux machine for this service to listen on a port (to which Fortigate will send the LOGs), and then Filebeat stores the LOGs in the Elasticsearch index we are interested in. So if you don't know where to install it, ELK's own machine can be totally valid, the steps we will follow are if we collect from a Linux, So, we installed Filebeat:
curl -L -O https://artifacts.elastic.co/downloads/beats/filebeat/filebeat-7.12.0-amd64.deb sudo dpkg -i filebeat-7.12.0-amd64.deb
We edit the Filebeat configuration file first of all as always “/etc/filebeat/filebeat.yml” and indicate at least the connection data to Elasticsearch and Kibana:
...
output.elasticsearch:
  Hosts: ["HTTP://DIRECCION_IP:9200"]
...
setup.kibana:
  host: "HTTP://DIRECION_IP:5601"
...
Next, we'll enable the Fortinet module:
Sudo Filebeat Modules Enable Fortinet
We also edit the configuration file of the Fortigate module “/etc/filebeat/modules.d/fortinet.yml”, We enable the collection of 'firewall'’ and if we have Forticlients, FortiMail or FortiManager as well, otherwise, the latter we leave disabled. Also to consider selecting which are the Internal and External interfaces; & Of course the listening port that we will have (In this example, the 9005):
- module: Fortinet Firewall:
    enabled: True Var.Input: UDP var.syslog_host: 0.0.0.0
    var.syslog_port: 9005
    var.internal_interfaces: [ "lan1" ]
    var.external_interfaces: [ "WAN" ]
    var.tags: [Fortinet-firewall, Strengthen yourself]
  clientendpoint:
    enabled: false fortimail:
    enabled: False FortiManager:
    enabled: False
And we tested the configuration:
filebeat test config -c /etc/filebeat/filebeat.yml -e
We load the indexes and dashboards for Kibana, We start the service, we enable it to start automatically and verify that the service started correctly:
Sudo Filebeat setup --pipelines --modules Fortinet sudo systemctl start filebeat sudo systemctl enable filebeat sudo systemctl status filebeat
Enabling LOGs in Fortigate,
And we configure Fortigate that spits out the logs to a syslog, Best by command line, since the GUI does not allow us to specify the port, and by CLI yes:
config log syslogd setting set status enable set server "DIRECCION_IP_FILEBEAT"
    Set port 9005
End
Playing with the LOGs,
What I said, If the data collection is correct and the index has been created correctly, we have little more to do (The index can be created manually by us if we do not follow the initial wizard we mentioned). From Kibana we will be able to discover what it collects, Add or remove fields, search in Lucene format or KQL format (Kibana Query Language).
And we will already be able to enjoy, for example, Grafana to interpret the data collected!! We will make a connection using a Data Source in Grafana of Elasticsearch type and indicate the connection data and then with the same Lucene queries that we did in Kibana, because we can make beautiful Dashboards.
I leave you an example of how to make a Donut or a cheese with the Top consumption of Apps discovered by Forti.
And then it's time to let your imagination run wild and add the visualizations we want.
On the blog you will see different examples of visualization, if in Tree Map format…
Table Example, where we can do filtering in the GUI…
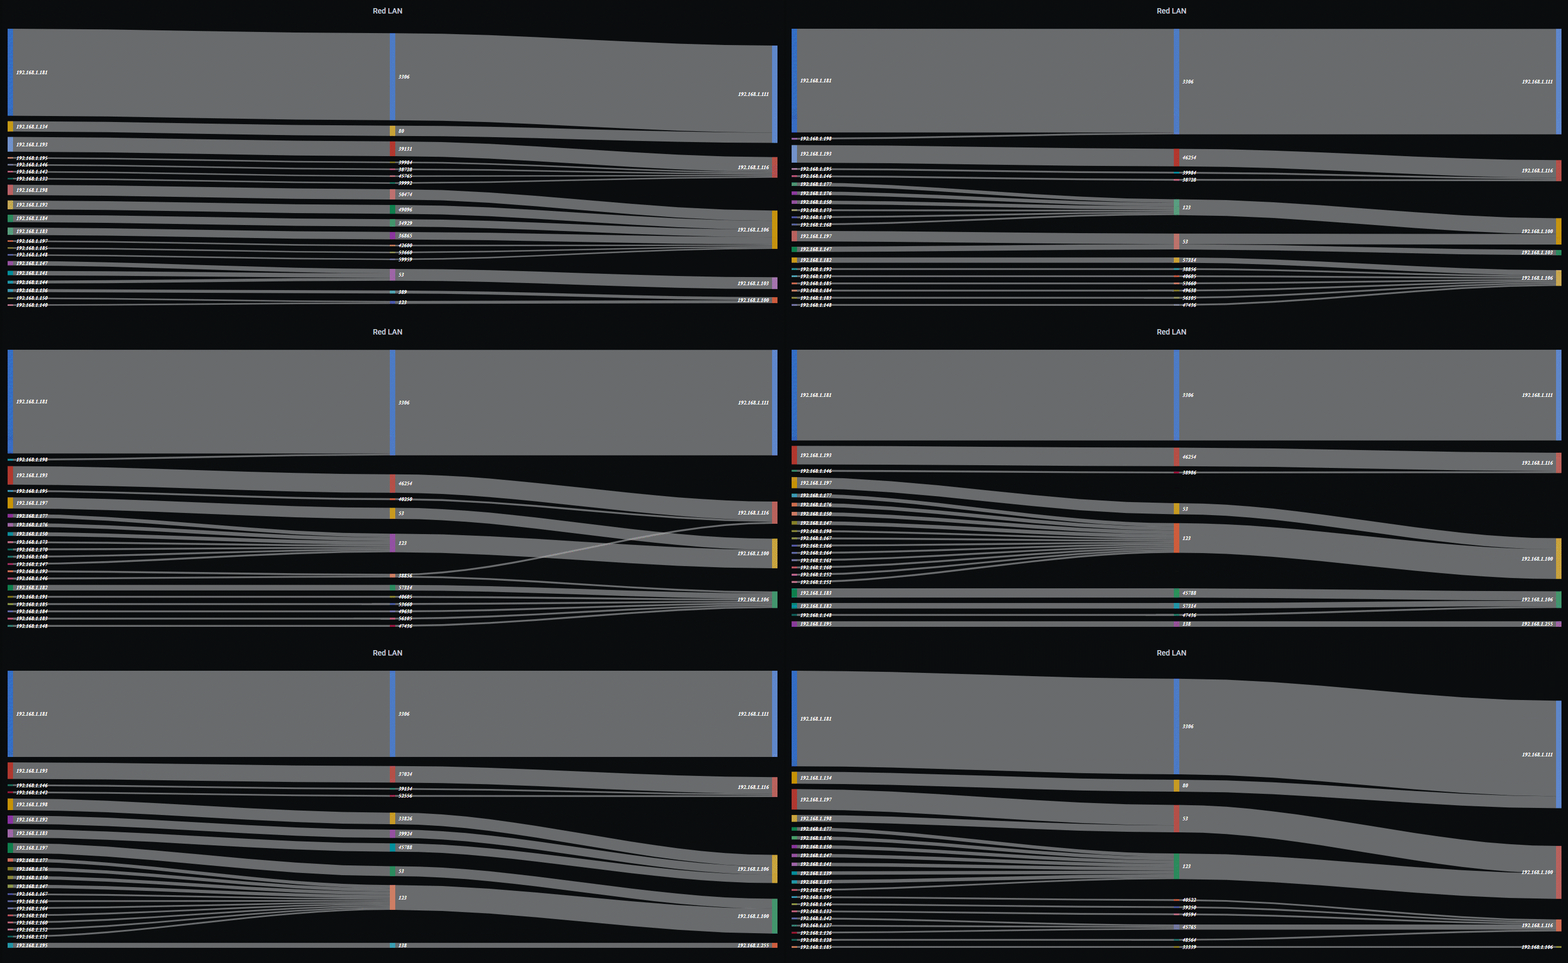
Sankey Diagram Example…
Maps of the world, where we can see incoming or outgoing connections, accepted or denied, in real time or in history of the last 24h, 7 days, 1 year…
What I said, In other documents you will see how to make each type of panel that you see in this post, I hope you like it and as always thank you for those likes on social networks!


