Exploiting Elasticsearch visualization in Grafana with Worldmap

Well, and this time we're going to exploit the IP addresses that we have stored in Elasticsearch indexes, we will visualize them on a World Map and thus we will understand where our data is going from or where it is going.
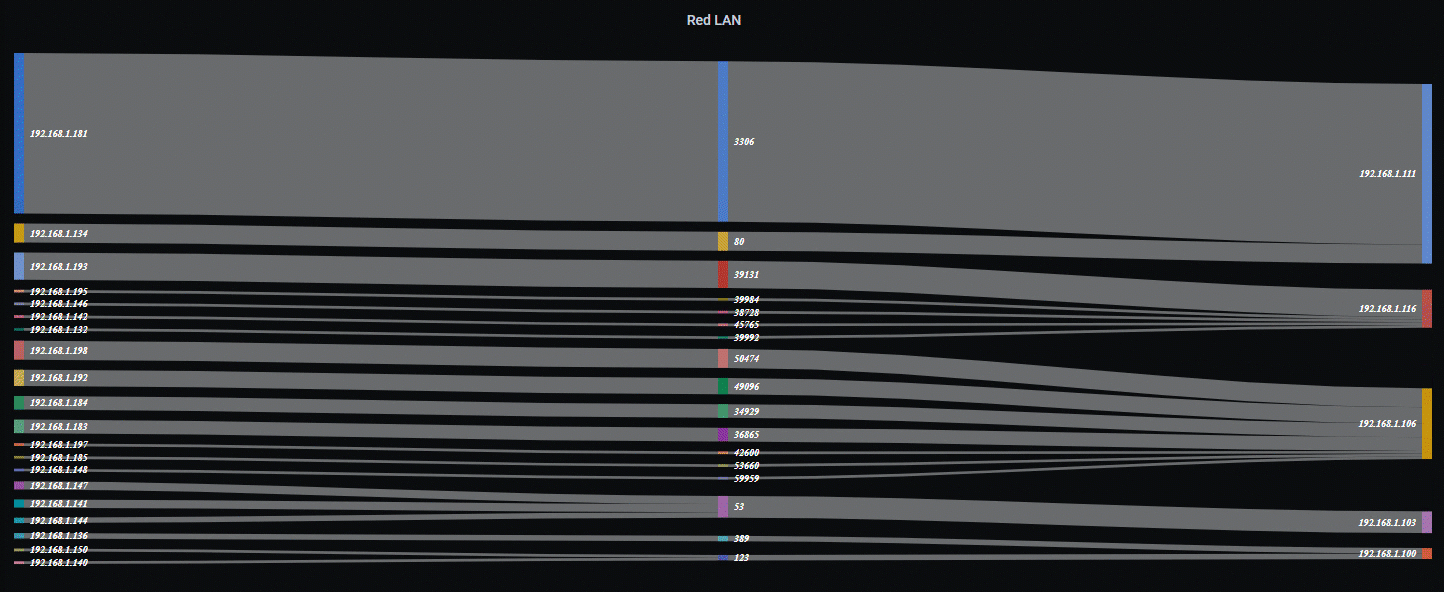
It will be very common for Elasticsearch to be storing LOGs from different systems, Be a Fortigate Firewall, an Apache server, an IIS, an IDS or IPS such as Meerkata that analyzes the connections of our network… Well, if we have public IP addresses, we will be able to geolocate them on a beautiful map of the world.
It will help us, for example, to see in real time where they access our organization from, or where we access, we can also not only see the incoming/outgoing connections, but also the data transferred and based on that the circle is more or less large or of another color.
Well, Installation is very simple, from the Grafana shell we install it & we restart Grafana services:
grafana-cli plugins install grafana-worldmap-panel service grafana-server restart

And in Grafana, we will now be able to create a Worldmap Panel, where by connecting to our Elasticsearch data source we can visualize the data that interests us. You can see in the image the configuration data.

And for example, if we have a Firewall, with Lucene queries we can make the maps that interest us, Traffic Output, Entry, approved, denied… per user if we have it integrated into the Active Directory… per FW rule…
And what I said, If we put Auto Refresh on it, it can look cool on a screen, where we see customers accessing our website, or whatever we want to visualize that we store in logs.