Collecting Windows metrics in Elasticsearch with Metricbeat and visualizing with Grafana

In this post, we'll look at another of Elasticsearch's wonderful components, within the Beats packages we will also find a utility that will help us to process and collect metrics from our Windows or Linux computers, known as Metricbeat. We will see how to export these metrics to Logstash to process them and store them in Elasticsearch to later visualize them with Kibana or Grafana!

GOOD, we must leave the Metricbeat light agent installed and running in the machines from which we want to absorb its metrics, is a Windows OS computer, Linux or Mac OS. We download Metricbeat from https://www.elastic.co/downloads/beats/metricbeat, we'll unzip it and , (For example) We left it at ' C:\Program Filesmetricbeat'. We will have its configuration file called 'metricbeat.yml' and another reference file with all the options that we can use, Called 'metricbeat.reference.yml'. In this example we will see on a Windows machine how to collect basic metrics such as CPU, Memory, Disk or Network, but that optionally if you run an interesting service we will enable the corresponding module to also collect said data. We will download Metricbeat, We'll set it up and install it as a service.
Configuring Metricbeat,
Well, before you start playing the Metricbeat configuration file; in the folder 'modules.d’ We will have all the additional modules from which we can also obtain metrics, are web services, Databases, Virtual platforms, such as Apache, Mongobus, Mysql, vsphere, PostgreSQL… In each module we can enable more or less metrics to be obtained.
In this example, in 'system.yml’ we'll see that it will redirect each 10 seconds CPU metrics, Memory, Network or information on processes, among others, We can comment or uncomment what we need, We can define this module or the one we are interested in specifying the information we are interested in collecting. Later we will see how to enable the modules that interest us, otherwise they will have the '.disabled' extension.
[SourceCode]- module: System
period: 10s
Metricsets:
– CPU
#- load
– memory
– Network
– process
– process_summary
#- Core
#- Diskio
#- Socket
process.include_top_n:
by_cpu: 5 # include top 5 processes by CPU
by_memory: 5 # include top 5 processes by memory
– module: System
period: 1m
Metricsets:
– filesystem
– FSSTAT
Processors:
– drop_event.when.regexp:
system.filesystem.mount_point: ‘^/(sys|cgroup|Proc|Dev|etc|host|Lib)($|/)’
– module: System
period: 15m
Metricsets:
– Uptime[/SourceCode]
After, in the configuration file 'metricbeat.yml’ We will carry out the rest of the configuration, in the General ===== section ===== we can add tags or additional fields in case we would be interested in associating this Metricbeat of the equipment with different keywords, so that they can then be used in different searches, how to indicate if it is a Server, is a database or web server, or have IIS, your SO...
[SourceCode]Tags: ["Servidor", "Windows 2016 R2", "OS-DC-01"]
fields:
globo_environment: Production[/SourceCode]
In the Output section, we will be able to send the data directly to Elasticsearch, But like in other posts, I particularly prefer to send the data to Logstash for processing. So we'll discuss the whole part of Output against Elasticsearch and configure against the Logstash server and its port, that in a previous document we saw in the part of “Configuring Logstash” the file to be created. As I said, we touch on the output leaving something like this:
[SourceCode]#——— Logstash output ———
output.logstash:
# The Logstash hosts
#Hosts: ["localhost:5044"]
Hosts: ["DIRECCION_IP_LOGSTASH:5044"][/SourceCode]

Once Metricbeat is set up, to install Metricbeat as a service we run:
[SourceCode].\install-service-metricbeat.ps1[/SourceCode]
And what I said, We can enable specific modules if we want additional monitoring on our machine, on this server I have a MySQL and an Apache, you should enable them:
[SourceCode].\metricbeat.exe modules enable Apache MySQL[/SourceCode]
As usual, the first time we add Metricbeat metrics to Elasticsearch, We must load the template so that it generates the indexes with the fields correctly:
.\metricbeat.exe setup –template -E output.logstash.enabled=false -E 'output.elasticsearch.hosts=[“SERVIDOR_ELASTICSEARCH:9200”]’
We can test if we have the configuration files correctly configured, from a PowerShell with administrator privileges, Let's go to the path where we have Metricbeats, and we execute:
[SourceCode].\metricbeat.exe test config -c .metricbeat.yml -e[/SourceCode]
And we start the service and if we want to,, we can see the status of the Metricbeats connection with Logstash or Elasticsearch (It depends on what we chose):
[SourceCode]Start-Service metricbeat
Get-Content .logsmetricbeat -Wait[/SourceCode]
And that's it! We should already have Metricbeat collecting metrics! Now let's visualize them… The magic is coming!
From Kibana,
If we want to visualize metrics with Kibana, First we will create the index pattern, then we will verify that data arrives and then we could start painting!

We open Kibana, We're going to “Management” > “Index Patterns” > “Create Index Pattern” and indicate 'metricbeat-*’ as a pattern, Click on “Next step”,
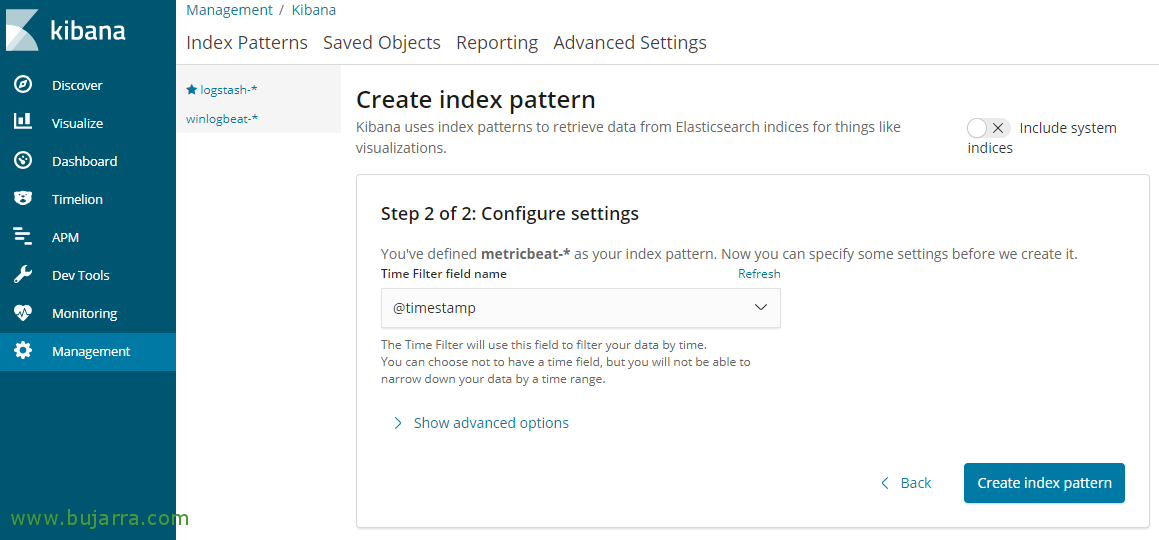
Select ‘@timestamp‘ as a time column and create the pattern from “Create index pattern”.

And from “Discover”, By selecting the pattern that we have just created, we will be able to see that we are receiving data, as usual, We can see what comes to us from here, Play to add columns and make filters and then create the visualizations from “Visualize” and see the metrics that we are monitoring in real time but in graph format, stalemate, Columns, Cheese…
From Grafana,
Before you can visualize the data, remember that we must register the data source and connect Grafana with Metricbeat indexes in Elasticsearch!
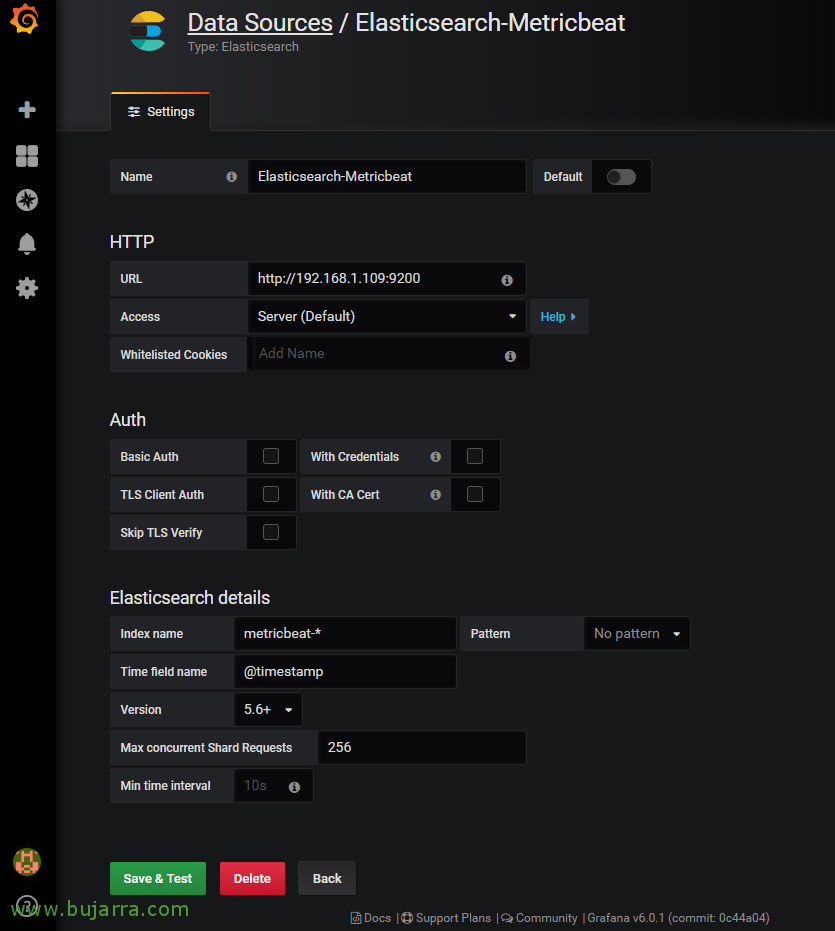
We open Grafana, Let's go to "Settings" > "Data Sources", We will give a name to the connection, in the URL we must indicate the URL of our Elasticsearch 'http://DIRECCION_IP_ELASTIC:9200’. Select 'metricbeat-*' to use as a name for the indexes, we indicate the @timestamp field for the time field and select the Elasticsearch version, click on "Save & Test",
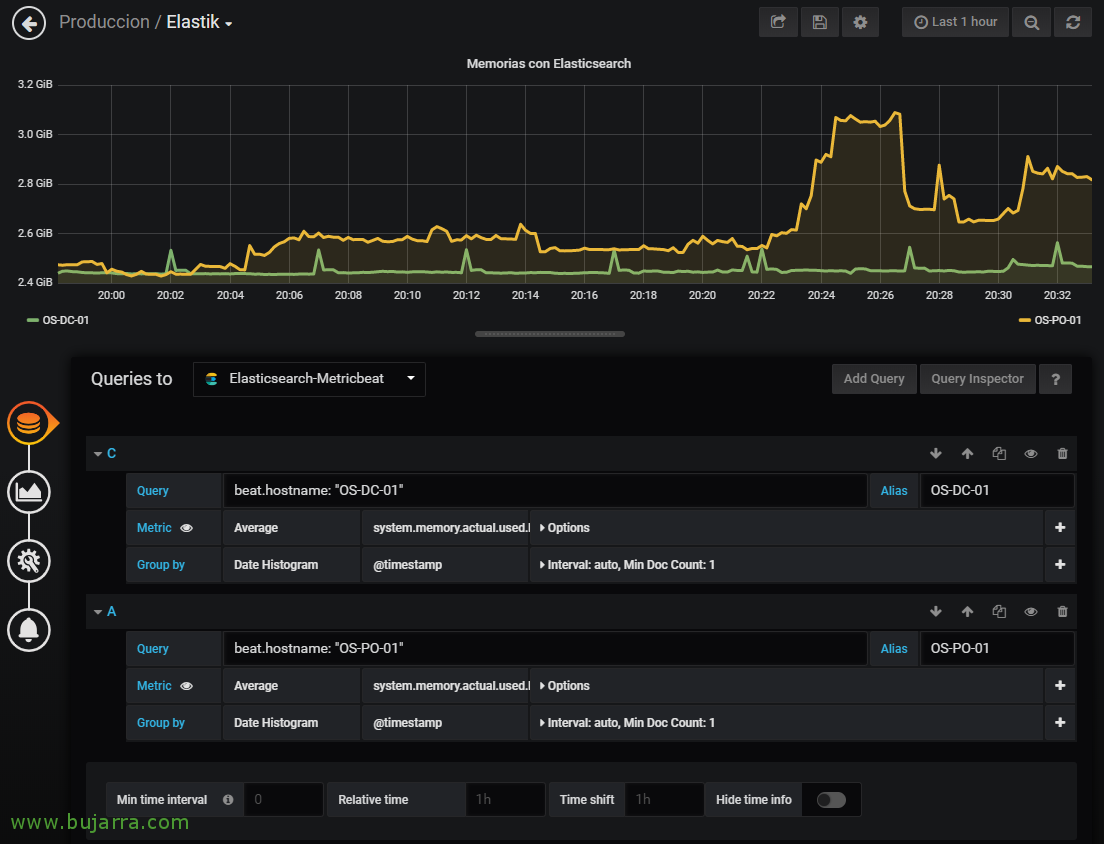
And we can add dashboards in a Dashboard to visualize the metrics generated by the machines that have Metricbeat installed! In a sample dashboard, in this case it will be a line graph, where we will visualize all the metrics generated by a couple of machines. We select our connector against Metricbeat indexes in Elasticsearch, and we can use Lucene queries from here to visualize what interests us.

And nothing, in a little while we will be able to analyze what data is reaching us and how to present and draw it with Grafana, You will see how it is not so complicated and we can visualize in a very pleasant way any information we collect, I hope you found it interesting!