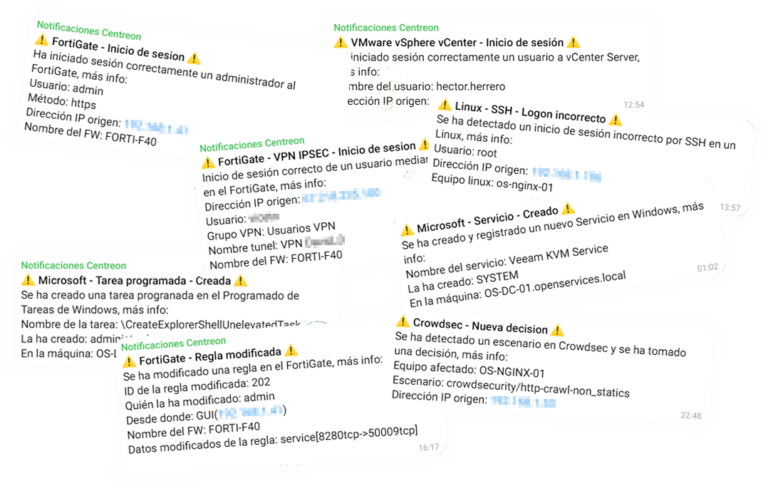
Redirecting Event Viewer events from Windows computers to Elasticsearch with Winlogbeat and viewing with Grafana

GOOD, once we have already set up our platform with Elasticsearch, Logstash and Kibana, In this first post, we are going to analyze the events of the Event Viewer of our Windows computers using Winlogbeat! We'll install the small agent and send the events we decide to Logstash to process and store in Elasticsearch, and then we will visualize them with Grafana!

The process will be straightforward, first we will download Winlogbeat from https://www.elastic.co/downloads/beats/winlogbeat, we unzip it and , for example we leave it in ‘ C:\Program Fileswinlogbeat'. We'll edit the configuration file 'winlogbeat.yml’ based on our needs, anyway in 'winlogbeat.full.yml’ We have all the options and features that we can use.
Configuring Winlogbeat,
In the first section of 'winlogbeat.yml’ we will be able to indicate which Event Logs and what type we want to redirect, We configure based on our need. Application is enabled by default, Security o System, (written in English), to see which ones are ours we have from a Powershell running 'Get-EventLog *’ We got him!
[SourceCode]winlogbeat.event_logs:
– Name: Application
ignore_older: 72h
– Name: Security
level: critical, error, warning
– Name: System
– Name: Veeam Agent[/SourceCode]
In the General ===== section we can ===== add additional tags or fields in case we would be interested in associating this Winlogbeat of the computer with different keywords, so that they can then be used in different searches, how to indicate if it is a Server, is a database or web server, or have IIS, your OS…
[SourceCode]Tags: ["Portatil", "Windows 10", "OS-PO-01"]
fields:
globo_environment: Production[/SourceCode]
In the Output section, instead of sending data directly to Elasticsearch, we'll run them through Logstash initially to be treated. So in the correct section we indicate the Logstash server and the port we want to use (In this example, the 5044), remember to comment on Elasticsearch Output with # And we left something like that:
[SourceCode]#——— Logstash output ———
output.logstash:
# The Logstash hosts
Hosts: ["DIRECCION_IP_LOGSTASH:5044"][/SourceCode]
If we have problems or we want Winlogbeat to generate a log for debugging issues, we must enable:
[SourceCode]logging.to_files: True
logging.files:
path: C:\Program Fileswinlogbeatlogs
logging.level: info[/SourceCode]
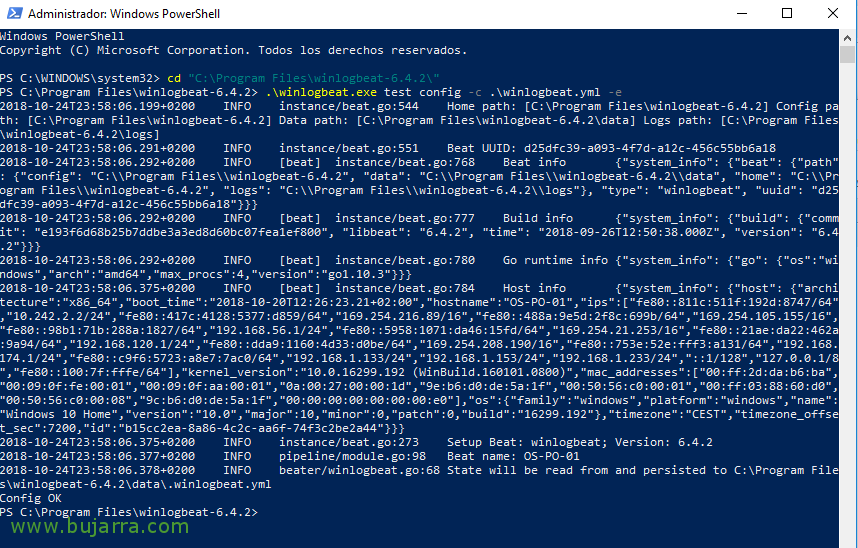
Once Winlogbeat is configured, we can test if we have its configuration file properly configured, we open a PowerShell with administrator privileges and go to its path, Run:
[SourceCode].\winlogbeat.exe test config -c .winlogbeat.yml -e[/SourceCode]
The first time we need to import the template with the field format that you need to generate in our Elasticsearch, Run:
[SourceCode].\winlogbeat.exe setup –template -E output.logstash.enabled=false -E 'output.elasticsearch.hosts=["direccion_ip_elasticsearch:9200"]'[/SourceCode]
Configuring Logstash,
Before you go any further, we're going to go to the Logstash server, and we're going to allow Logstash to accept the Winlogbeat logs and store them in Elasticsearch. We'll use a single configuration file called '/etc/logstash/conf.d/beats.conf’ to process logs we receive from other Beats products in the Elasticsearch suite, and it will generate an index for each one, Something like this will help us:
[SourceCode]Input{
Beats{
port => "5044"
}
}
output{
ElasticSearch {
hosts=> ["DIRECCION_IP_ELASTICSEARCH:9200"]
index => "%{[@metadata][Beat]}-%{+YYYY-MM-dd}"
document_type => "%{[@metadata][type]}"
}
}[/SourceCode]
We restart Logstash so that the changes take effect:
[SourceCode]Service Logstash Restart[/SourceCode]
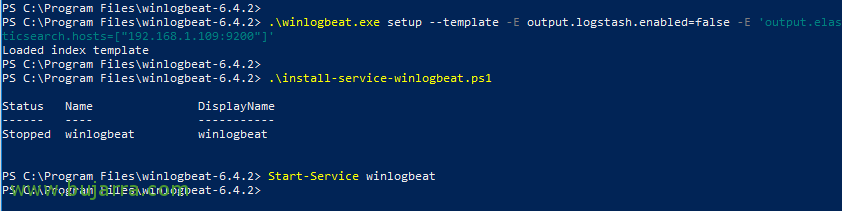
We return to our Windows team, install Winlogbeat as a service on our Windows and we can start it:
[SourceCode].\install-service-winlogbeat.ps1 → Install as a Service
Start-Service winlogbeat[/SourceCode]
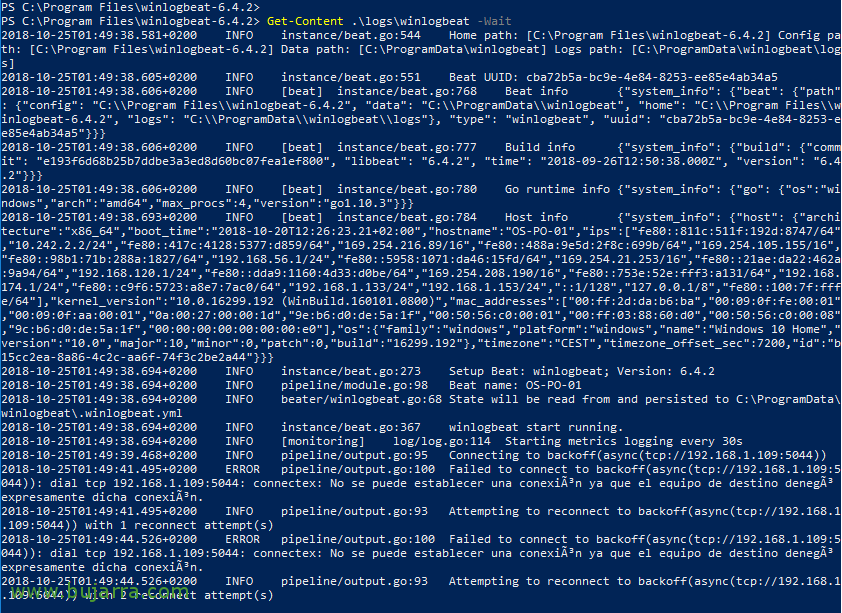
and if we want to see the status of the connection we can run:
[SourceCode]Get-Content .logswinlogbeat -Wait[/SourceCode]
From Kibana,
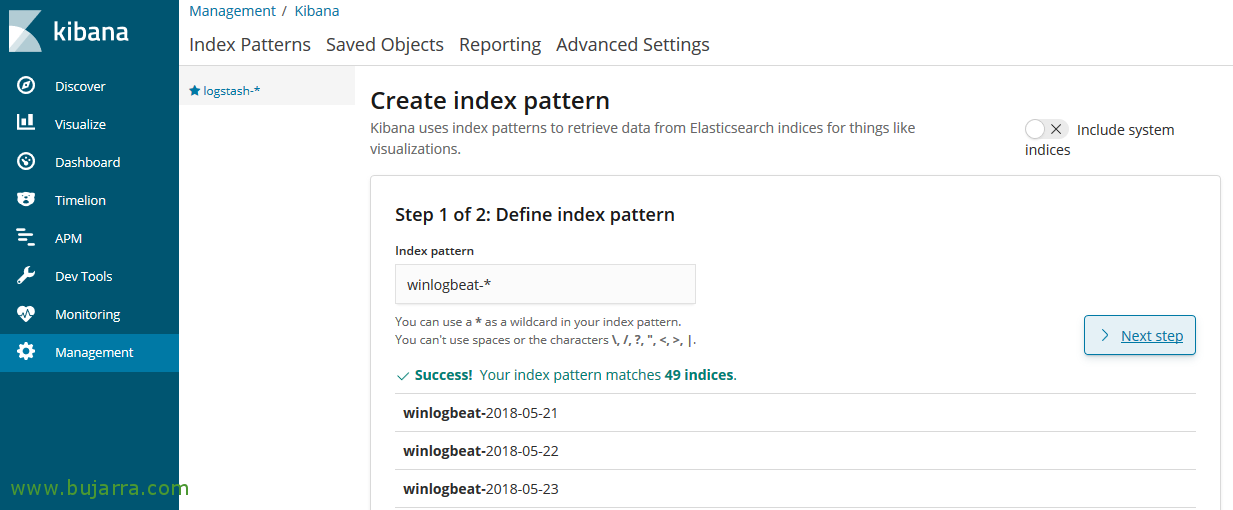
GOOD, now from Kibana we will create the pattern for this index, we open Kibana, “Management” >” Index Patterns” > “Create Index Pattern”, We indicate as pattern 'Winlogbeat-*’ and we follow the wizard,

Select the field ‘@timestamp’ To use as a time filter, and “Create index pattern”.
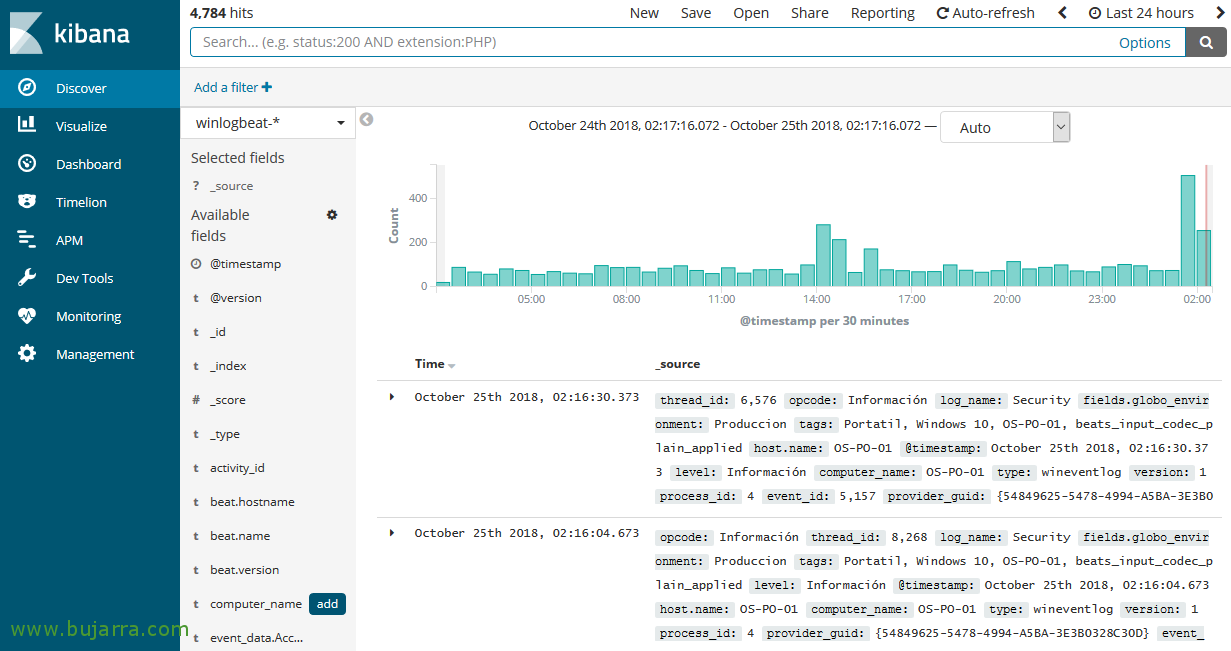
To see the data we have been obtaining, We're going to “Discover”, we selected the newly created pattern from Winlogbeat, If everything has gone as it should, our Windows computers will be sending the events to Logstash and Logstash to Elasticsearch, We will have stored the logs of all the events that we have redirected!

We can add the fields we want to visualize, or all… as well as filtering searches with Lucene's syntax, to view a team's events something like 'computer_name: “NOMBRE_EQUIPO_WINDOWS”‘, o 'level: “error”‘ it will filter and show us the events of the Windows Error level. By tapping you can see that you can simply make queries as you want to visualize the data you want…
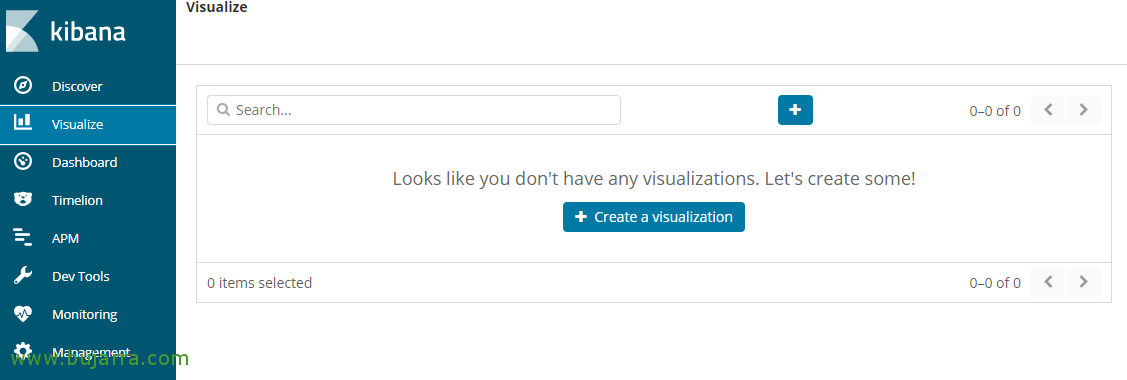
If we want, with Kibana we will be able to create visualizations of this data and capture it in a graphical way, something much more intuitive than what we have just seen, since “Visualize”!

We will see that we will be able to create table-type visualizations, Areas, Heat Maps, Bars, Lines, Cheeses… But, personally as I like Grafana is what we will see next. I don't mean that I don't encourage you to discover Kibana, which is a real blast, You will see that in a very simple way you will be able to view any data you like.
From Grafana,
What we are going to see in this part, is how to initially create a Grafana to Elasticsearch connector, then how to create our first Dashboard and visualize the data we are storing in Elasticsearch in a different and cool way.
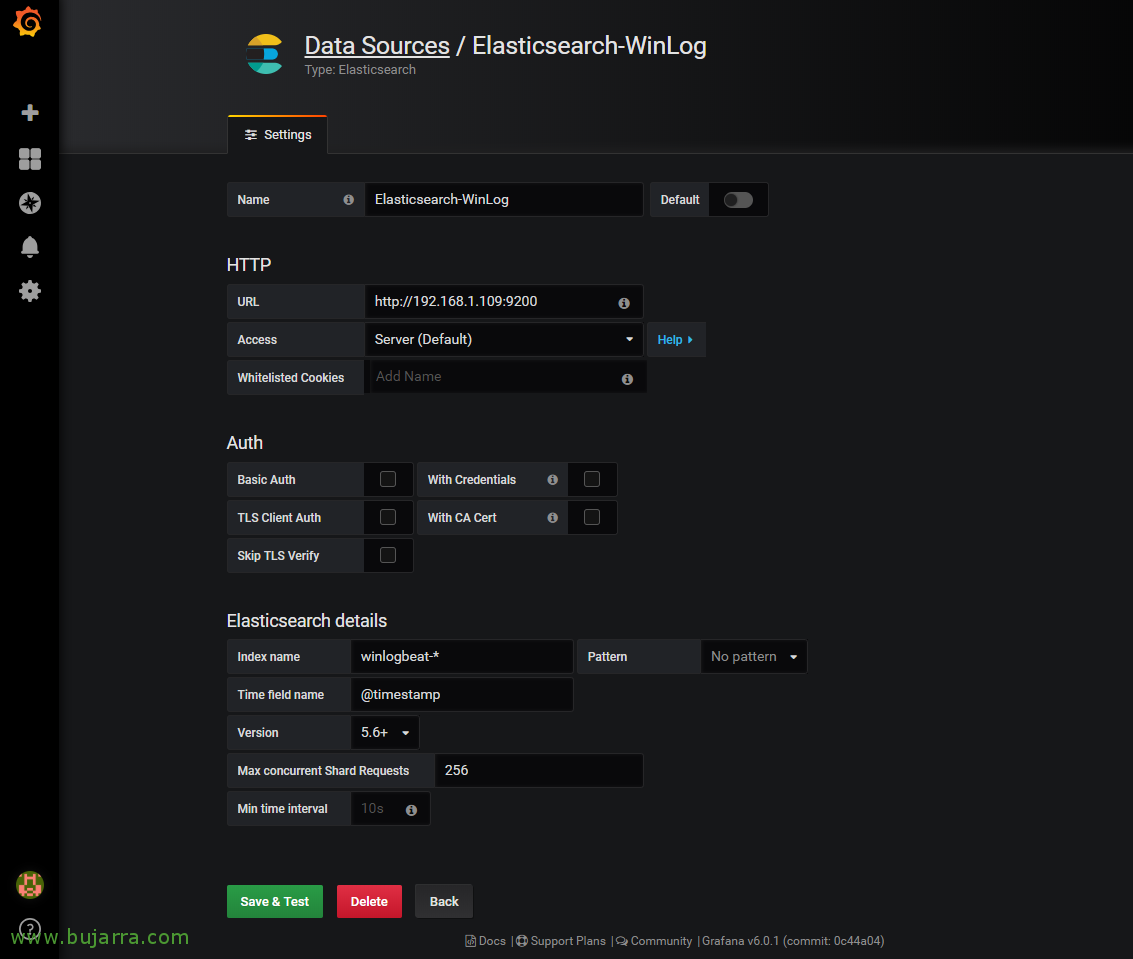
From our Grafana, we can go to “Configuration” > “Data Sources”, We will give the connection a name, in the URL we must indicate the URL of our Elasticsearch 'http://DIRECCION_IP_ELASTIC:9200’. Select 'winlogbeat-*’ to use as a name for indexes, we indicate the @timestamp field for the time field and select the Elasticsearch version, Click on “Save & Test”,
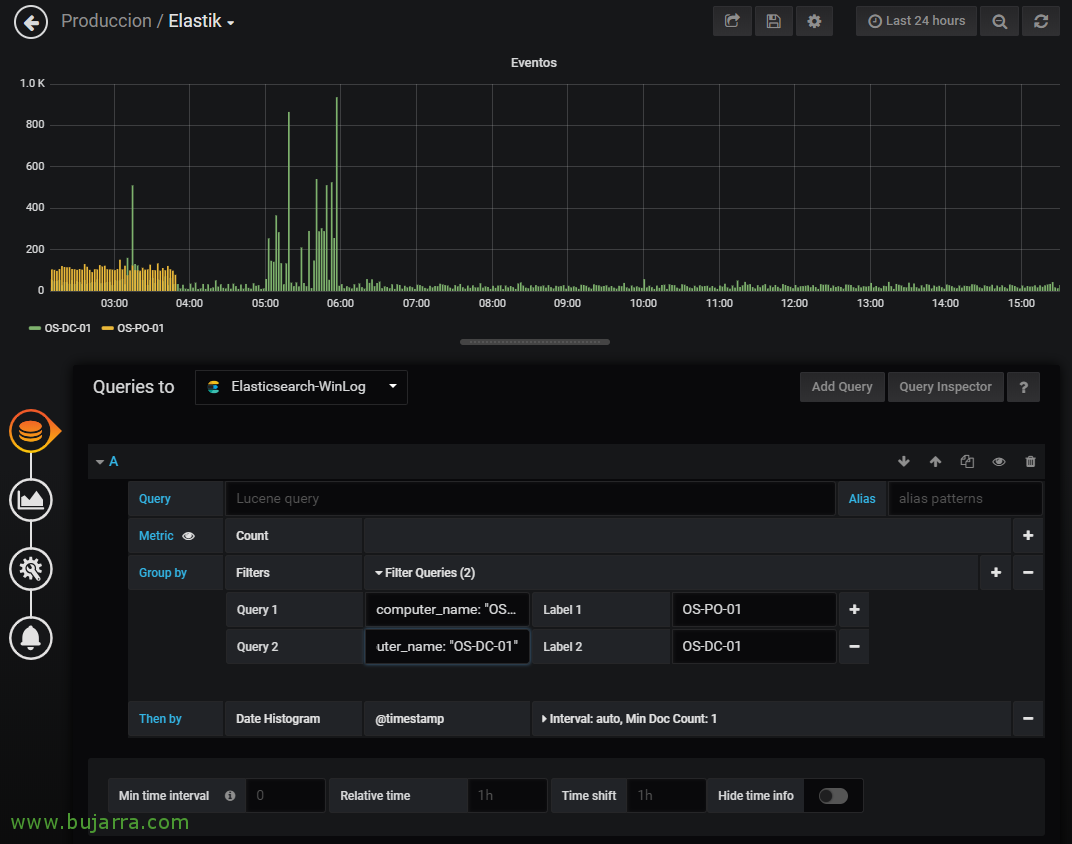
And it's time to create our first Dashboard! Within it we created a Panel, in this case it will be the typical bar, where we will visualize all the events generated by a couple of machines. We select our connector against Winlogbeat indexes in Elasticsearch, and we can use the same Lucene queries from here to visualize what interests us.

And well, We'll create the types of visualizations we're interested in seeing, Here we see the latest 24 hours of my teams, Your Information Events, those that are Warning and those marked with Errors, Cheese and Bar Display, you will see that in a few seconds you will make yours!!! I hope you have found it interesting,