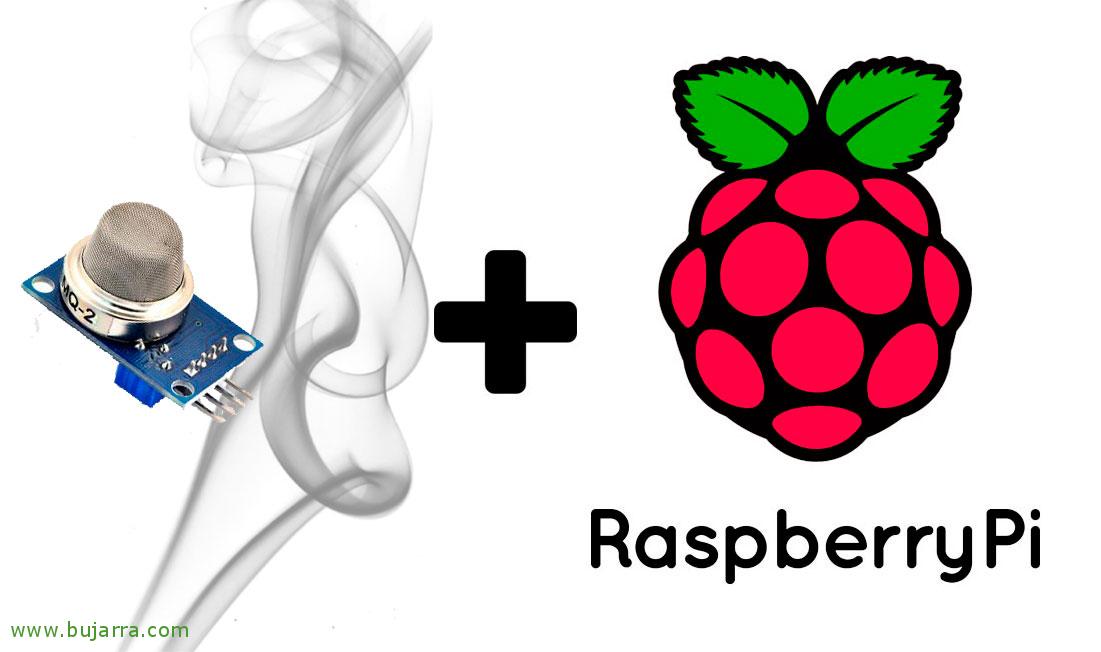
Smoke or Gas Sensor with Raspberry Pi
If we want to analyze some type of gas with a Raspberry Pi, we can make it very simple with MQ sensors, we will only need to know in any case which sensor to obtain depending on the gases to be analyzed and that's it, We will see in this post how to connect it and get the values. As usual, at the end we will save the data obtained in a MySQL database to visualize it from Grafana!
What I said, first will be to know which MQ sensor we will use, in this post we will rely on an MQ2 that analyzes Methane, LPG & Smoke, but you should know that we also have among others the MQ3 to obtain Alcoho, Ethanol & Smoke, with the MQ4 we will be able to obtain Methane and compressed natural gas or CNG, MQ5 for Natural Gas & LPG, with the MQ6 we will obtain LPG and butane gas, with the MQ7 carbon monoxide, with MQ8 Hydrogen, MQ9 for carbon monoxide and flammable gases, MA131 for Ozone, MQ135 for Benzene, Alcohol and Smoke, MQ136 Hydrogen Sulfide, MQ137 for Ammonia, MQ138 would give us the values of Benzene, Toluene, Acetone, Propane, Alcohol and formaldehyde gas… and so on until we decide which cheap sensor we are going to acquire to detect the gases we are interested in. What I said, in this post we are based on an MQ-2.
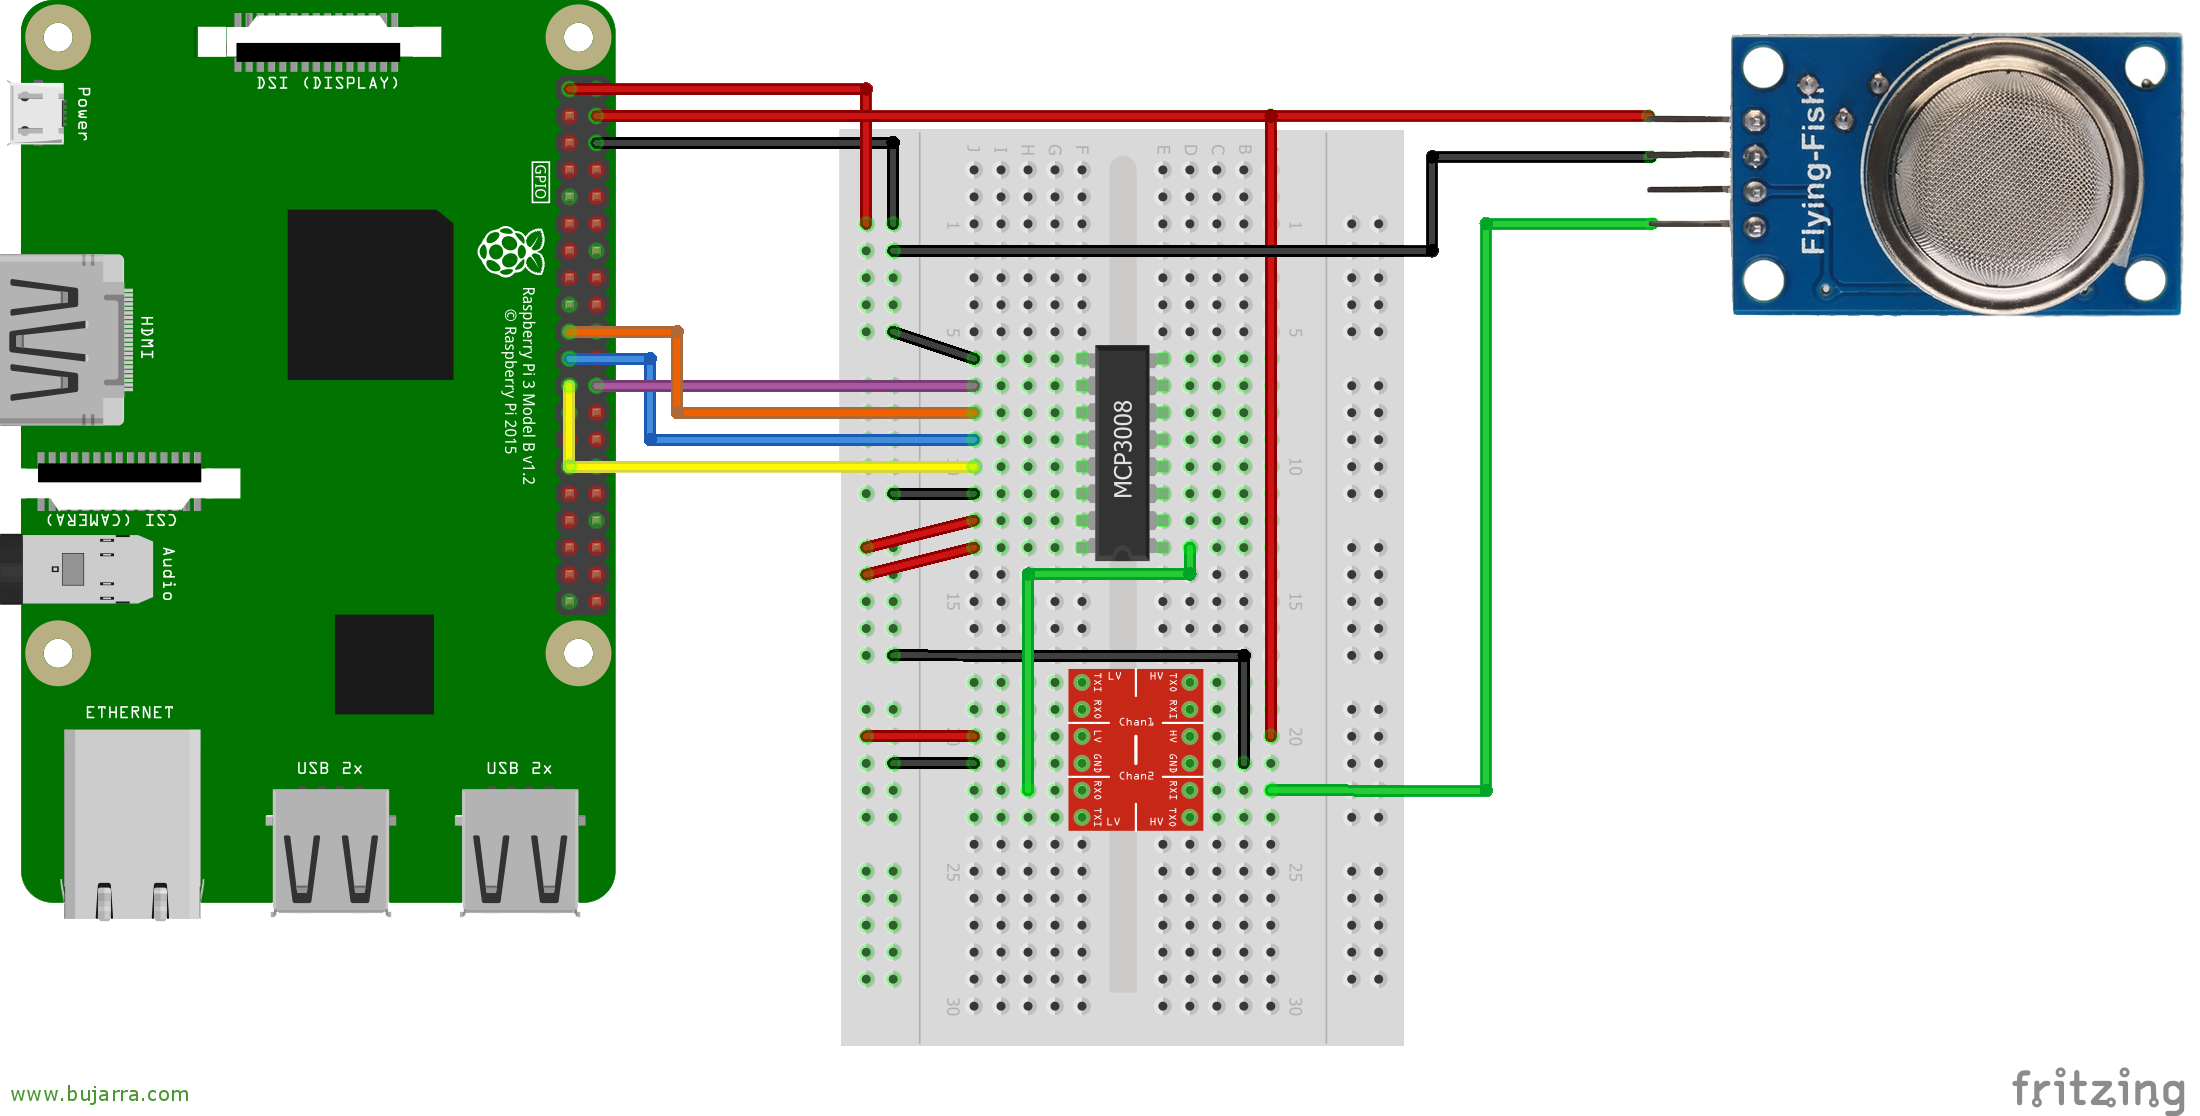
Apart from the sensor, we will also need an Analogue-Digital converter, I use a MCP3008 and also a logic level converter 3.3 at 5V. We see in the image how to connect the GPIO of the Raspberry to the sensor. By the way, the sensor can be regulated if we need it with a screwdriver, But wow, Usually comes in handy, is to test…
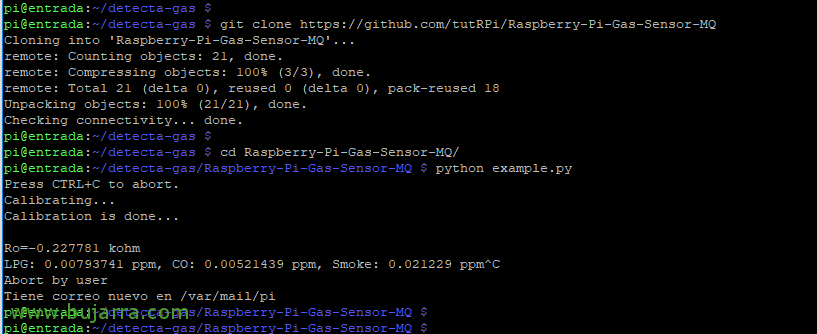
And on the software side, suppose we have a Raspbian running, we downloaded a wonderful tutRPi script from GitHub and tried to run it, It's that simple:
[SourceCode]git clone https://github.com/tutRPi/Raspberry-Pi-Gas-Sensor-MQ
cd raspberry-pi-gas-sensor-mq
python example.py[/SourceCode]
And if we modify it a little… each one as they need and like… In my case you already know this script I will run when I start the Raspberry Pi using cron, every 60 It will put the values it obtains from the sensor into a table in a database. Then let's see how we visualize it with Grafana… This is how the script would look:
[SourceCode]
From mq importa *
import sys, Time
mq = MQ();
while True:
perc = mq. MQPercentage()
print perc["GAS_LPG"]
print perc["CO"]
print perc["SMOKE"]
import MySQLdb
db = MySQLdb.connect("DIRECCION_IP_SERVIDOR_MYSQL","USUARIO","CONTRASEÑA","BASE_DE_DATOS")
cursor = db.cursor()
cursor.execute("""INSERT INTO gases (LPG, CO, smoke) VALUES (%s, %s, %s) """,( perc["GAS_LPG"], perc["CO"], perc["SMOKE"]))
db.commit()
time.sleep(60)
[/SourceCode]
That said, this script stores in a table called gases that have 4 Columns, 3 of them are gases (LPG, CO and smoke) and another is the date, I leave you the code in case someone needs it and have an identical table for the previous script:
[SourceCode]CREATE TABLE 'gases' (
'LPG' FLOAT NULL DEFAULT NULL,
'CO' FLOAT NULL DEFAULT NULL,
'smoke' FLOAT NULL DEFAULT NULL,
'date' TIMESTAMP NOT NULL DEFAULT CURRENT_TIMESTAMP ON UPDATE CURRENT_TIMESTAMP
)
COLLATE='latin1_swedish_ci’
ENGINE=InnoDB
ROW_FORMAT=COMPACT
;[/SourceCode]
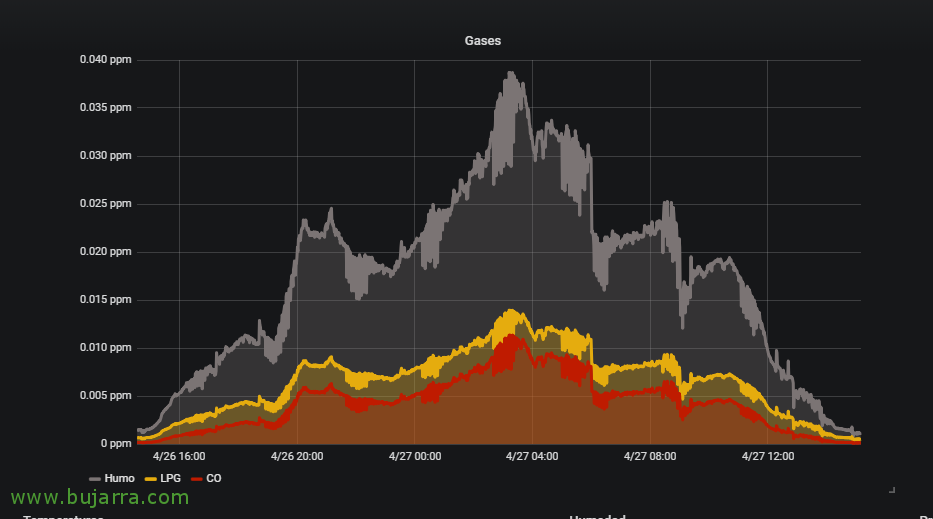
And already in our Grafana, we can add a Graph Dashboard in a Dashboard for example and make queries to the MySQL DB to draw the metrics of the gases we are analyzing. It looks very cool, No?? I'll leave you in case you need the Querys I'm making:
[SourceCode]SELECT smoke as value, "Humo" as metric, UNIX_TIMESTAMP(date) as time_sec FROM gases WHERE $__timeFilter(date) Order by time_sec ASC
SELECT LPG as value, "LPG" as metric, UNIX_TIMESTAMP(date) as time_sec FROM gases WHERE $__timeFilter(date) Order by time_sec ASC
SELECT CO as value, "CO" as metric, UNIX_TIMESTAMP(date) as time_sec FROM gases WHERE $__timeFilter(date) Order by time_sec ASC[/SourceCode]
List! I hope you found it interesting, you have already seen on the blog other types of sensors to connect to a Raspberry Pi and know the state of our environment! to enjoy!!!


