Monitoring a Linux computer with Centreon, example with a Raspberry Pi + Temperature of your CPU

I'm going to put this post because of all the requests I've been receiving on how to monitor a Linux server. As obviously depends on the distribution, today we have an example with a Debian and more specifically we will see it on a Raspberry Pi that carries Raspbian. We'll monitor basic metrics like CPU, RAM, Swap Memory, Disks, Network Traffic, Uptime… And in the end we will see something very interesting!
Well, Started, the first thing will be to install the SNMP daemon:
[SourceCode]Sudo apt-get update && sudo apt-get install snmpd snmp -y[/SourceCode]
We will edit the SNMP configuration file and modify the following lines where we will first enable SNMP to listen through all the interfaces of the machine and then we will establish an SNMP community and filter what range of IPs can make queries (Nagios Machine, Centreon…), in this case we will use version 2 SNMP:
[SourceCode]sudo nano /etc/snmp/snmpd.conf
…
agentAddress 161
…
rocommunity public 192.168.1.0/24
…[/SourceCode]
We finally restart the service so that it rereads the configuration:
[SourceCode]sudo /etc/init.d/snmpd restart[/SourceCode]

And finally we can go to Centreon to create the host of this Linux computer to monitor it, It will be very simple, by adding the base template of a Linux server we will have already monitored the basics. So in “Configuration” > “Hosts” > “Add…” and we create the Linux team as we want, We will tell you your name, IP address, SNMP community and in Templates we will add at least the OS-Linux-SNMP-custom or without custom 🙂
We save the host,
And if we don't have the templates loaded, Check out This post how to install the Plugin Packs Manager and the templates we are interested in.

If we record/reload the Centreon settings as we already know, We will be able to verify that we already have our Linux host monitored with certain services that come by default.
Now modify or add as many Services as you need to ensure that the service offered by that machine goes well, such as knowing if a process is active or not, Check out This post. And if not, attentive, below we see a very particular and super kuki case to continue monitoring this Linux.
Monitoring the output of any script
Let's look at a very interesting case, I have a script on my Linux machine, I want to run it and read what it spits out… We will use a very interesting case study, we are going to monitor the CPU temperature of the Raspberry Pi with Centreon. First we will obviously need to have a script on the Raspberry that reads that temperature and we will execute it when Centreon makes a query through a specific OID that we will use from SNMP!
We will create the following script on our Raspberry Pi:
[SourceCode]sudo vim /usr/local/bin/snmp-cpu-temp[/SourceCode]
And paste the following code:
[SourceCode]#!/bin/bash
if [ "$1" = "-g" ]
then
ECHO .1.3.6.1.2.1.25.1.8
Echo gauge
ECHO $(('cat /sys/class/thermal/thermal_zone0/temp|cut -c1-2')).$(('cat /sys/class/thermal/thermal_zone0/temp|cut -c3-5'))
fi
exit 0[/SourceCode]
We make it executable:
[SourceCode]SUDO CHMOD +X /usr/local/bin/snmp-cpu-temp[/SourceCode]
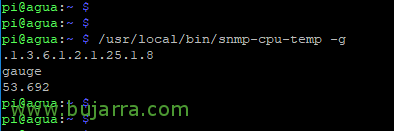
If we want to test it from the Raspberry Pi we run:
[SourceCode]/usr/local/bin/snmp-cpu-temp -g[/SourceCode]
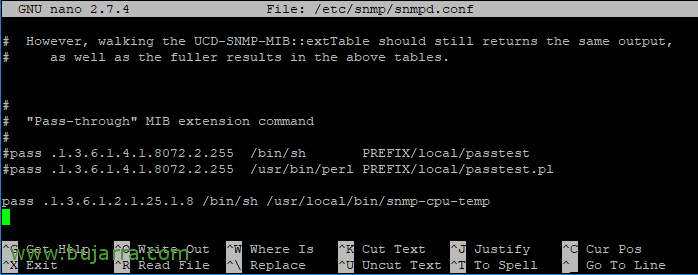
GOOD, What we will do now is edit the /etc/snmp/snmpd.conf' file, and under the '”Pass-through” MIB extension command’ We add the following:
[SourceCode]pass .1.3.6.1.2.1.25.1.8 /bin/sh /usr/local/bin/snmp-cpu-temp[/SourceCode]

We restart the SNMP service so that it loads the new configuration with:
[SourceCode]sudo /etc/init.d/snmpd restart[/SourceCode]
And we tested it in local x example with:
[SourceCode]/usr/bin/snmpget -v 2c localhost -c public .1.3.6.1.2.1.25.1.8[/SourceCode]

At Centreon we modify if we need the 'check_snmp' Command from “Configuration” > “Commands”:
- Command Name: check_snmp
- Command type: Check
- Command Line:
[SourceCode]$USER$1/check_snmp -H $HOSTADDRESS$ -C $USER 2$ -o $ARG 1$ -w $ARG 2$ -c $ARG 3$ -l $ARG 4$[/SourceCode]
Click on “Describe argumments” and we indicate what each Argument means so that when we create the service we know what to put in each field. The ARG1 would be the OID, ARG2 the Warning value, ARG3 the Critical and ARG4 text to be displayed as metric value in the graph.
We recorded the Command,

And we create the Service from “Configuration” > “Services” > (We clone an existing one), We edit and modify it:
- Description: CPU Temperature, the name of the Service go.
- Linked with Hosts: We associate the Service we are creating with the following teams that we want to check the temp and we have done the previous process (Create scripts…).
- Template: Select the template from which we will inherit the configuration that we are interested in and do not want to enter manually, What notifications usually look like… In my case I use generic-active-service-custom.
- Check Command: Select from the list the Command modified in the previous step, and we complete the values of the Arguments:
- OID: .1.3.6.1.2.1.25.1.8 What is the OID we use to run the script that reads the CPU temperature.
- Warning: 40. From 40 degrees that sing us a Warning.
- Critical: 80. From 80 degrees that the temperature marks as Critical.
- Display Text: What I said, will be the text that we will see in the graph, The metric, go.
We record the Service,

And that's it! if we record/reload the Centreon settings, we will be able to see the temperature of our Raspberry Pi at a glance! I dedicate this document to all of you who have asked me to know how to monitor a server or Linux computer using SNMP, So super easy, You've already seen it, He is sucking!