3 Free ControlUp Tools for Citrix Environments

In this first document about the large manufacturer Control Up we will see some totally free tools that it offers us and can help us to start knowing how we have the status of our Citrix platform. See 3 interesting utilities that will help us measure the loading time of an app, Perform logon simulations to see times and an attractive tool that will give us information about what is happening in our NetScaler!

ControlUp is a well-known manufacturer of monitoring solutions, has excellent products that will give us in real time any metric to know at all times the status of Citrix platforms (among other solutions, Of course). We will see that in another post, where through a cloud panel we can access the data of our infrastructure and see at any level what is happening. If we want to start seeing what they can offer us, Why not Try These Free Utilities?
In this post we will see:
- Logon Simulator
- App Profiler
- NetScaler Monitor
Logon Simulator
Tool that will load an application or desktop, It will measure us charging times, etc… We download it from here.

When it comes to executing it, it will be enough to indicate the URL of our StoreFront or NetScaler server, We fill in the field of which resource to open, where we will put the app or desktop to test and finish by entering the data of the test user and the times of the test or if we want it to be repeated N times…

After pressing Play, we will see how the test is executed and we will have different tabs through which we can move to see time data, Connection issues…
App Profiler
This utility will allow us to select an application within our VDAs, and optionally pass some parameter when opening it, it will measure where the times are going when its execution begins. We can lower it from here.
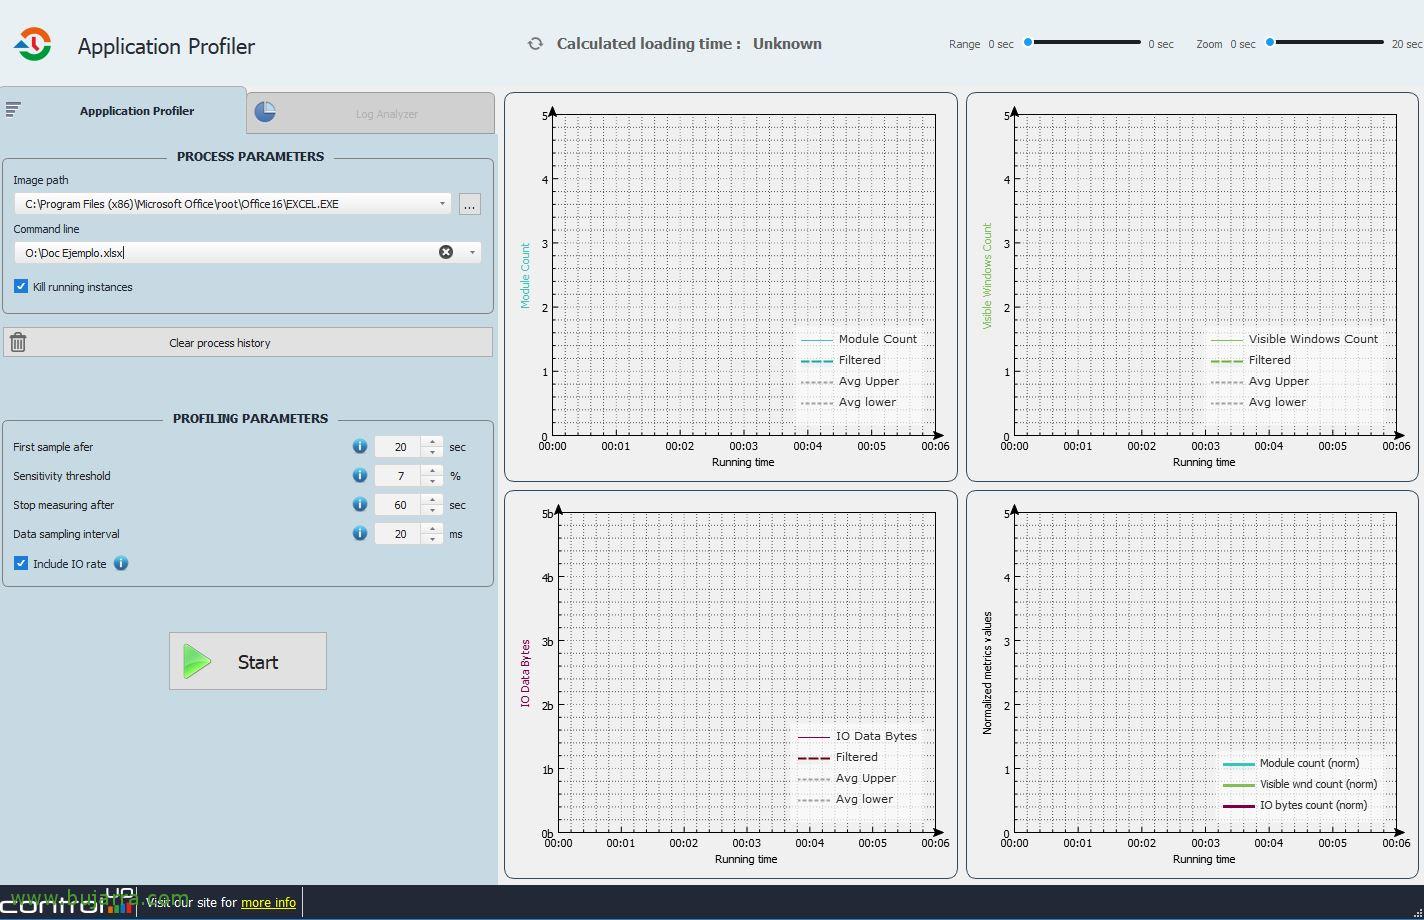
After running the Application Profiler application, We will indicate the name of the executable we want to open and indicate its parameters,

We press Start and see how the app opens and start collecting…

After the appropriate time and finish the app opening, We will have some graphs that will guide us to know where the times are going in the apps that take time to open, if you transfer a lot of data…
NetScaler Monitor
This one is personally my favorite, since it will give us at a glance all the information that our NetScaler has, we will be able to see the Load Balancing, Your servers and services, View traffic, load… in addition to watching HDX sessions… We download it from here.

In this screenshot we will be able to see the Load Balancers, where going down we see the load data, availability, traffic… of each node or server, or each service… being able to stop them from here as well.

From HDX Sessions it will show us the users who are going through this NetScaler, the portal where they are, your public IP address, which port they connected with, whether with session reliability or not…

And finally, in System it will show us data from NetScaler itself, and things as interesting as if we have the config recorded, Firmware, detailed CPU consumption, Memory, net…
Well, I hope you found it interesting, These are three simple utilities that in case of need come in handy to know and delve into any problem, Anyway, you can take a look at the products they have, You have trials of 30 Great days to get to know your infrastructure at a low level!