Monitoring a Synology Array

If we have a Synology NAS array in our environment, we should take into account centralizing and monitoring its status, No? It will be very easy to integrate it into our Centreon and be able to know at all times its health and that of its components such as disks or volumes, as well as consumption or temperatures! These types of cabins must be under control, since they usually store either backup backups or directly all the company's data.
It really won't cost us much, since the first thing will be to create the Host in our Centreon and assign the OS-Linux template, with this we will be able to monitor most of the basic checks such as the CPU, RAM or Swap Memories, Disc sizes, Network or Uptime. Then we'll use the ‘check_snmp_synology‘ with which we can add and know the status of the power supplies, ventilators, Disk Status, Volume Status (RAID), DSM updates, Temperatures… as well as their general condition. And then by means of OIDs we can obtain the different temperatures.

The first thing will be in each Synology array to enable SNMP, we will do it from “Panel de Control” > “Terminal and SNMP”, and enable SNMP service, we set the version of the community that we are interested in and we set the SNMP community, Click on “Apply” and it's ready.

The next thing will be to register our Synology machine in the Hosts within Configuration in our Centreon, We will indicate a name, An alias, the established SNMP community and the SNMP version. We'll add the OS-Linux-SNMP-custom template, since from there we will create almost all the services we will need to monitor the cabin, What are the CPU like?, Memoirs, Disk usage, net, Uptime…
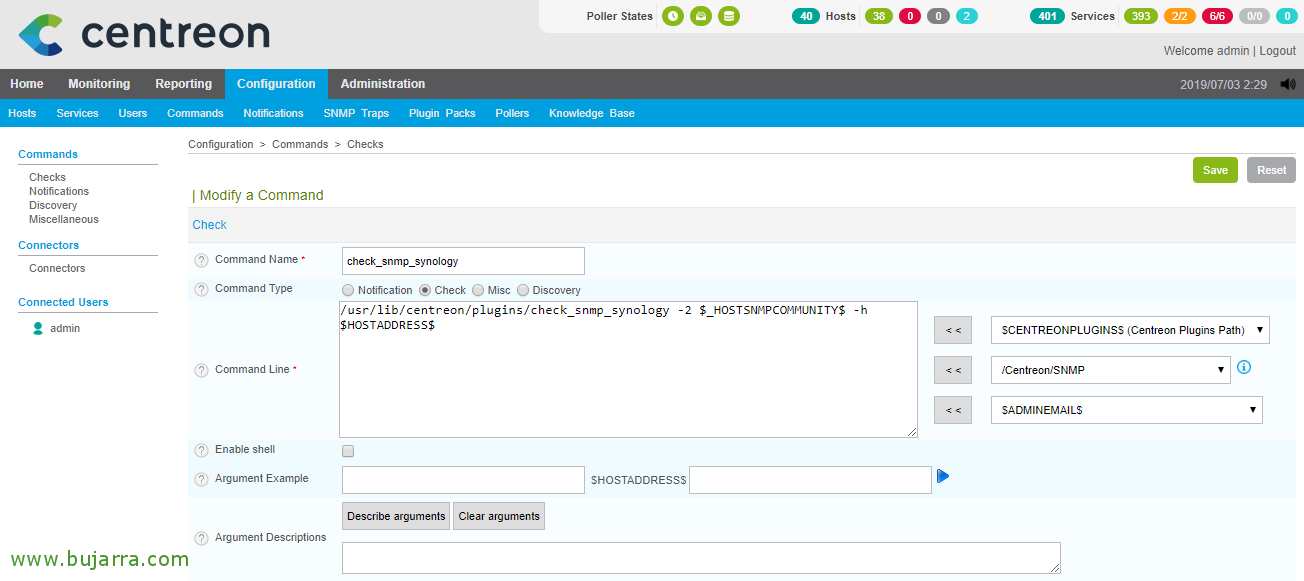
If we want to monitor the status of the cabin itself, that is, the health of its components we will use the Script indicated, we leave it in the Centreon plugins folder and make it executable. Then we create the Command as usual in Centreon and with this same example without arguments we can get the general state of the SAN from Synology:
[SourceCode]/usr/lib/centreon/plugins/check_snmp_synology -2 $_HOSTSNMPCOMMUNITY$ -h $HOSTADDRESS$[/SourceCode]
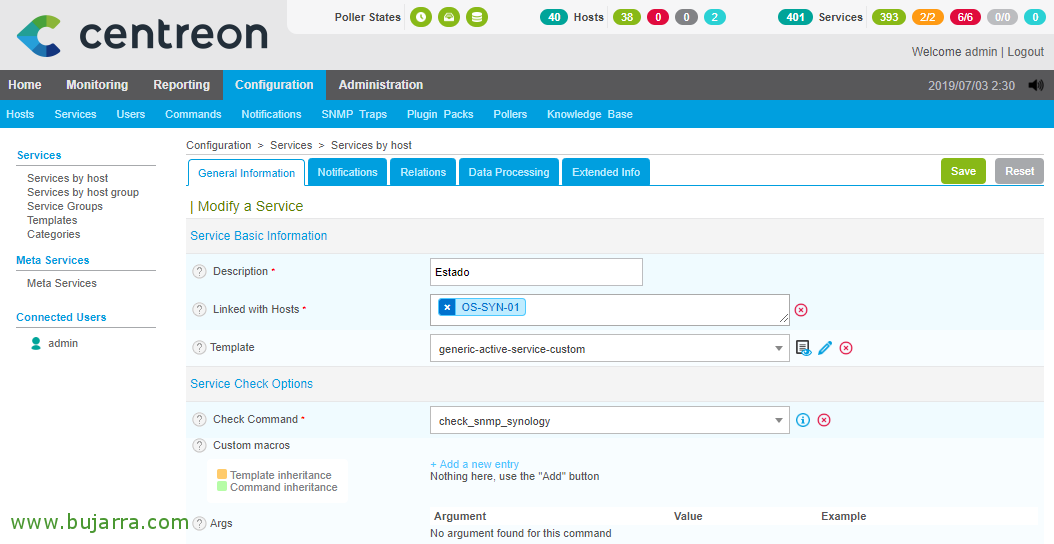
We ended up creating the State Service, we will associate the newly created Command with it and it will be ready, since it doesn't need arguments (In this case).

More, if we want to monitor other parameters, what is the temperature of the discs like?, it is best to attack your OID and visualize it in Centreon, we could use if we want alerts values of Warning and Critical that I'm not using in this particular case. If you want to remember how to monitor OIDs, Check out This post.
And by the way, if you want to know the entire list of Synlology OIDs, Check out This link to see the main ones, And if you want Here is the full list, You can monitor any story!
As an example that I leave you, Screenshot OID, '.1.3.6.1.4.1.6574.2.1.1.6.3’ Bring out the temperature of the hard drive 3.

And as always, after saving and exporting the configuration files in Centreon, we will now be able to return to the monitoring view and filter to find the status of our Synology cabin, I tell you that this will leave you calm, has long alerted me to disk failures… and in time the problems were solved! I hope you found it interesting!