Auditing access to removable storage devices

The use of removable storage devices is usually not allowed in organizations, you should not at least be able to connect a USB flash drive or removable hard drives. But it is true that in exceptions, They are needed, and for this purpose a GPO is usually defined with a whitelist of allowed USB devices and applied to the users/computers that need them. But ,How do you use them??
It is very easy to know which files or archives our users have accessed, Modified or Removed, as we have already seen in some Previous Post. In this case, we only want to know the accesses to the files or files (or folders) that they may have used on removable storage devices, as are pen drives, USB drives…
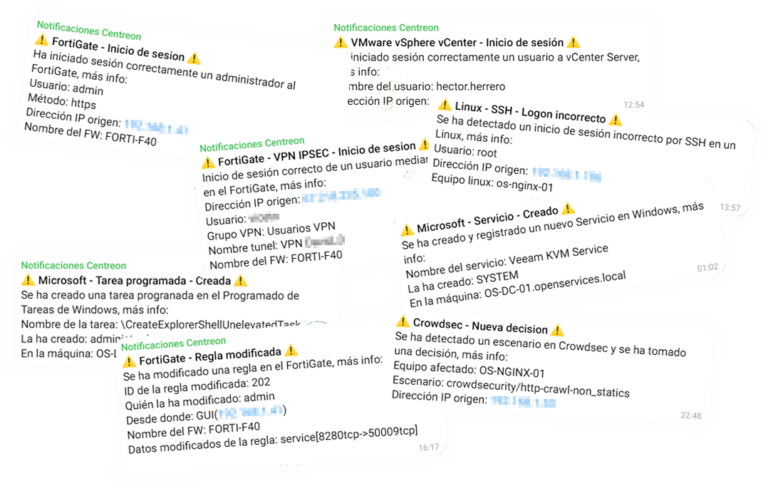
In the end, everything will be collected in the Event Viewer of the teams, in Security events, we will be able to search by the Event ID 4663 And we'll have everything. But as we already know, it is tedious to have to look for things there, That is why as we are collecting in a series of posts, It is advisable to centralize where the logs of our servers and workstations are stored, for this we will use the Elastic agent as always, which will be the one to send the logs and store them in Elasticsearch, so that you can see them in beautiful, understandable and be able to make queries from Grafana, as well as if we want to generate PDF reports…

So if we already have our Elastic agent running as a service on the, and collects the security events of the Event Viewer, we will have to create a GPO where we will force the access logs of the removable drives to be audited, such as a USB flash drive, for this, since “Security Settings” > “Advanced audit policy settings” > “Accessing Objects”, we will mark both the successes and the errors of “Audit removable storage”.
With that we will have everything and the events will begin to be generated and stored, so we will be able to access them as always from Grafana, from a Datasource that we have configured against the index where Windows events are saved, be it WinlogBeat-* or Filebeat-* possibly. We will have that, create the Dashboard in Grafana to your liking, depending on what you want to see.
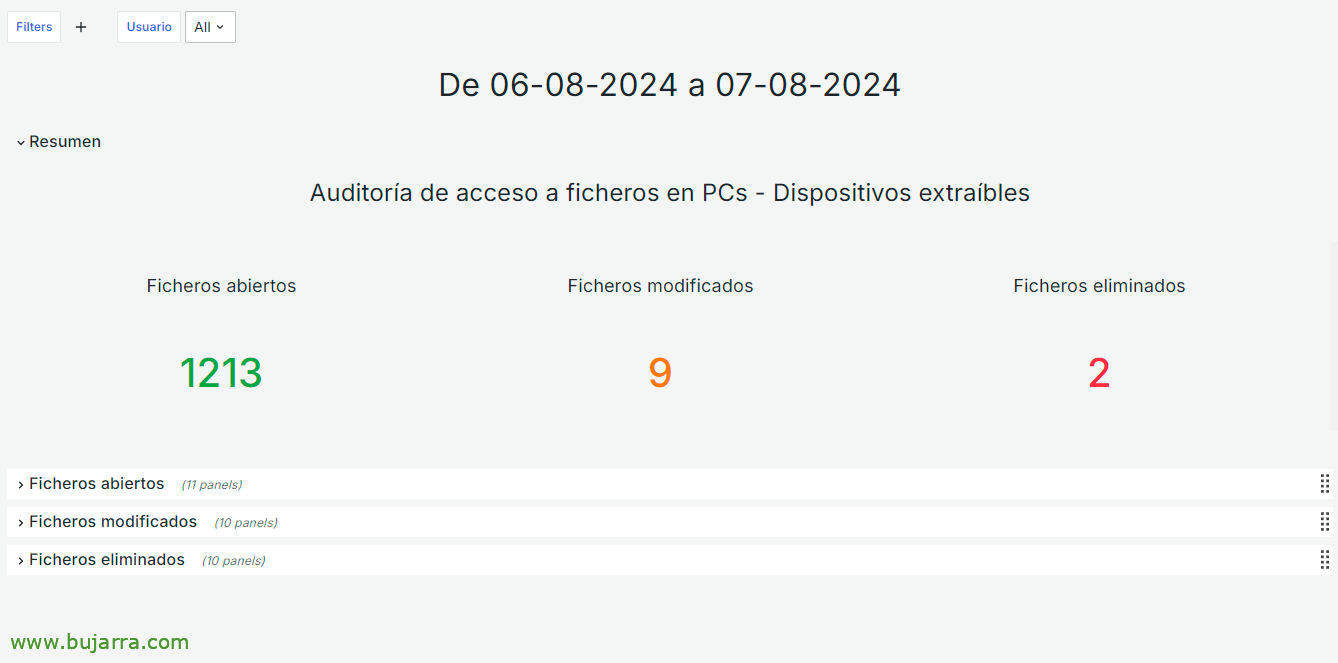
This example shows a summary, by the period of the indicated date and it could also be filtered by user, to see in particular what someone did exclusively.

Below the summary we could already view the open files, Only what's opened. Being able to see it in a time graph, A lookup table, make a top of which users have opened the most files, or which files are the most open, as well as a Sankey to relate it visually…
Total, that with the following DSL query we could from Grafana or from Kibana see the results of the open files:
winlog.event_id: 4663 AND winlog.event_data. AccessMask: "01"
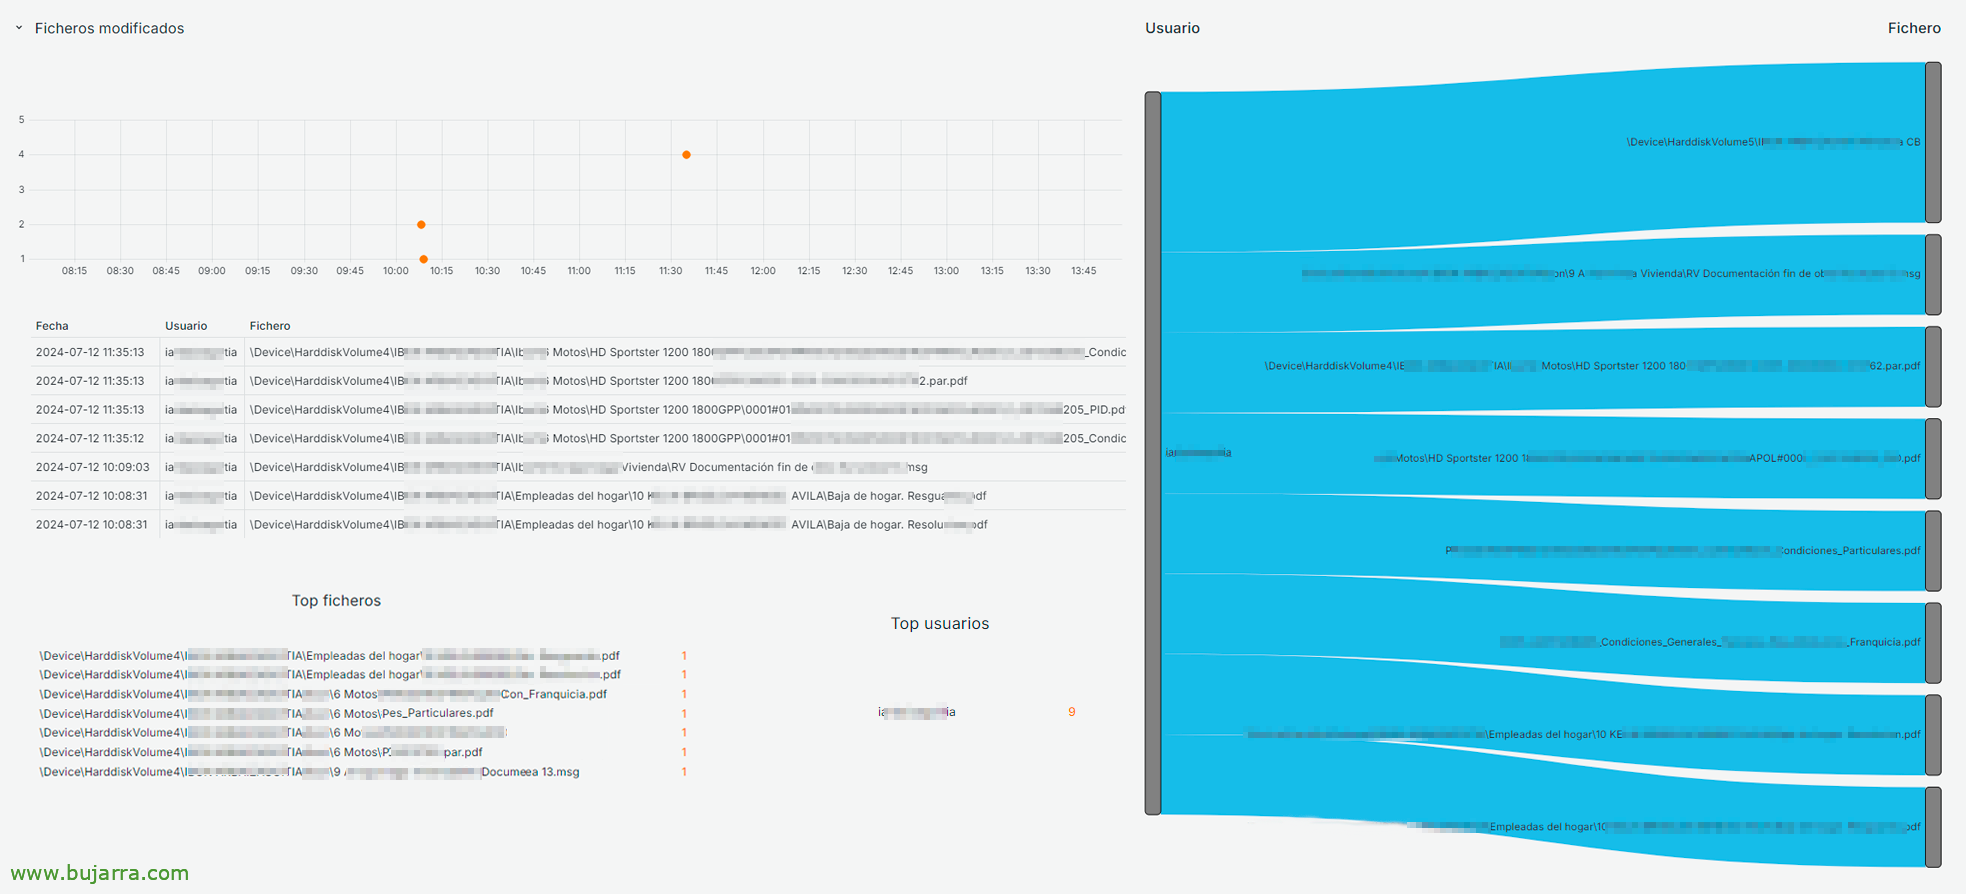
If we download the Grafana dashboard a little further we will find the files that have been modified in the selected period, We can find them from the following query:
winlog.event_id: 4663 AND winlog.event_data. AccessMask: "02"

And at the end of this Grafana Dashboard we can find the files that have been deleted or deleted, And the same, in order to find these files, we must make them from the following query:
winlog.event_id: 4663 AND winlog.event_data. AccessMask: "0x10000"
Now we have collected any access to files on external drives of our organization's computers, we can have control, Save them for legal issues, have a PDF report with its summary every day… The possibilities are many, I hope you found it interesting and encouraged you to keep everything under control, I send you a hug, May it go well!