File access auditing with Elasticsearch and Grafana

This post is quite curious, since we can audit the accesses to the organization's files for free, collect those events in and store them in Elasticsearch, For what, then in a masterful way our Grafana allows us to easily visualize the accesses. And see who opened a document, modified or deleted it.
If you currently serve your files to your users through Windows servers and would like to know what is happening in there, you probably know that there is the possibility of auditing file accesses through a policy or GPO, To see who does what. The problem is to understand that data, since in Windows we should use Event Viewer and for that we shoot ourselves, ¿truth? So, Let's take this data out. We know that with the Winlogbeat agent we can collect events from a Windows machine and store them in Elasticsearch, and of course Grafana is always there to give us a hand and visualize that data in a more comprehensive way.
Well, let's start by getting to the point, since we have a very similar post, that of Logon auditing of Active Directory users with Elasticsearch and Grafana, where we already saw how to deploy the base or configure Winlogbeat. So the only thing different we need today, is to tell our file server to audit the accesses to the files.

To enable auditing on files, This is, so that when you open a file, modify, or when deleting is audited in Event Viewer, the most convenient thing will be to create a GPO that we apply to the file server. And enable the 'Audit Object Access'’ (Successes and mistakes) since “Policies” > “Windows Settings” > “Security Settings” > “Local Policies/Audit Policies”.

Now we only have to enable auditing in the folder that interests us and contains the data we want to monitor. We'll do this from the folder properties > eyelash “Safety” > “Advanced options” > eyelash “Audit” > “Add”.
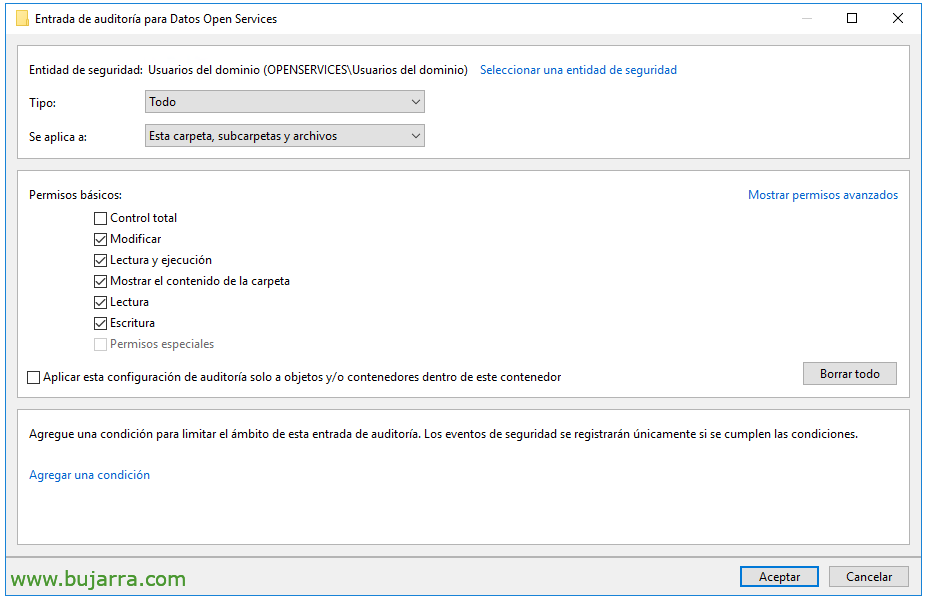
And here we'll select to apply to this folder and its contents, and the type of permissions we want to audit. We accept and ready.
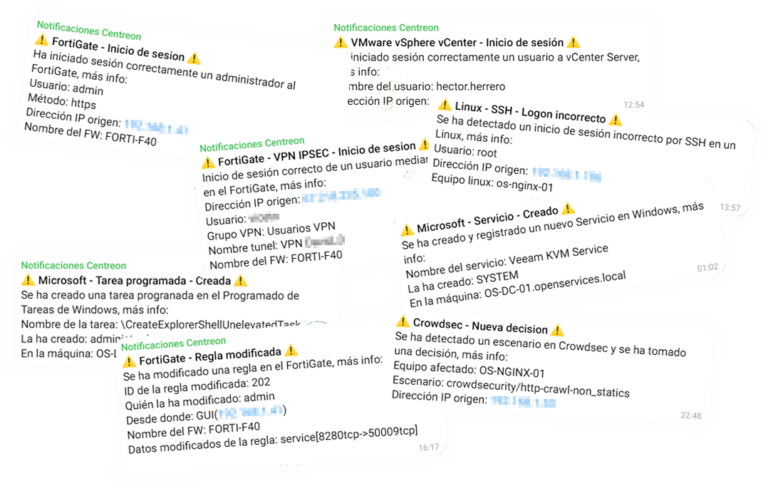
What I said, now if we already have Winlogbeat on this machine collecting the events of the Event Viewer we can see how the file access events begin to appear in the Elasticsearch index. Little more than getting started with Grafana! And in Grafana also remember that before making the Dashboard we have to have the Datasource against Elasticsearch configured, that we have seen in previous posts. 🙂
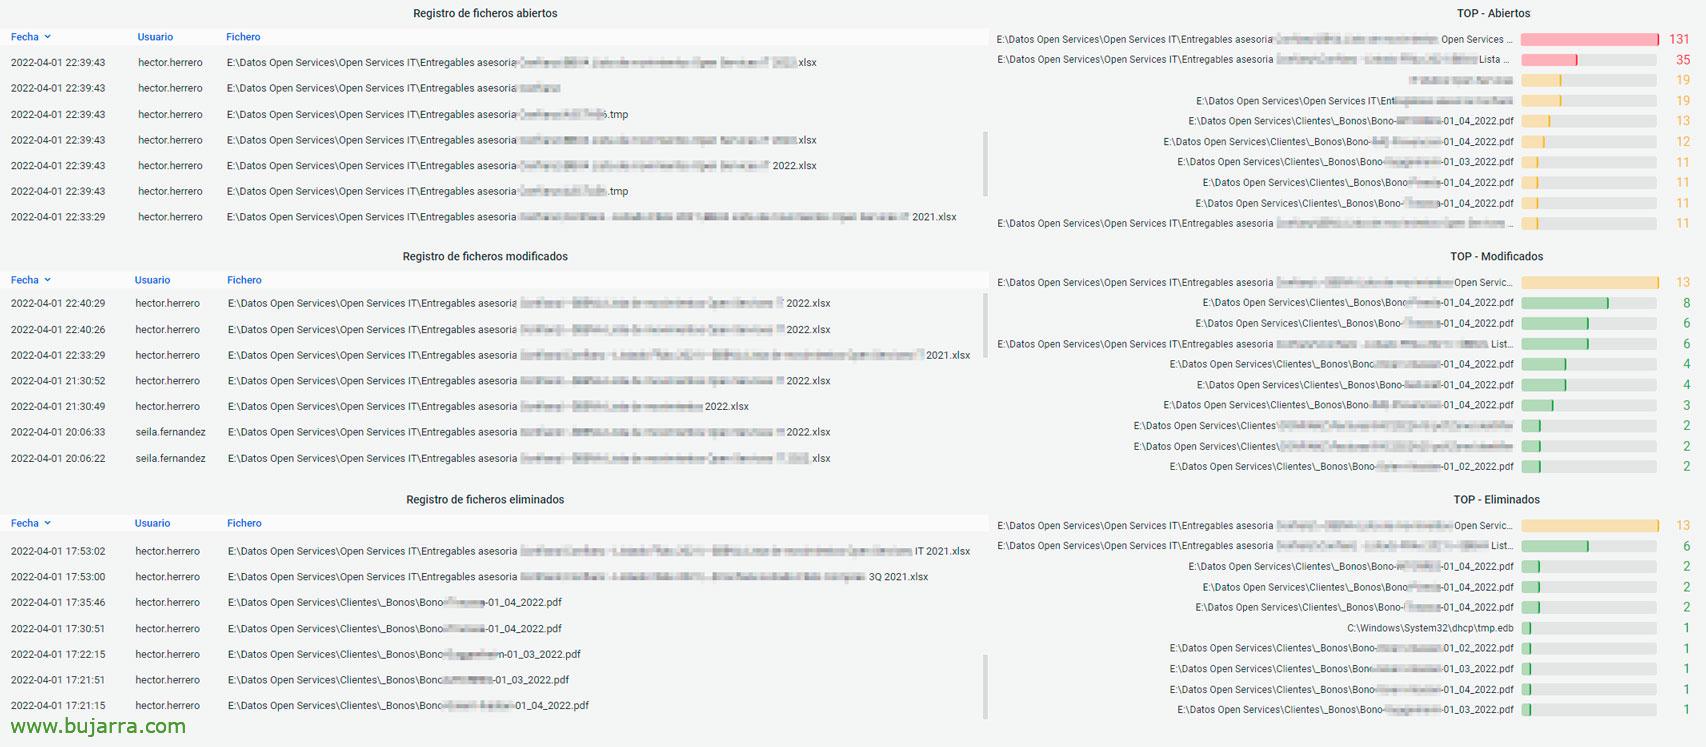 And nothing, in no time at all you can create a Dashboard, with for example Panels of type Table that consult the files that are touched by users, I leave you the queries that I am using so that it does not take you a minute to have this image that I leave you as an example.
- Open files:
winlog.event_data. AccessMask: 0x20000
- Modified files:
winlog.event_id: 4663 AND message: *WriteAttributes* AND NOT winlog.event_data. ObjectName:*.tmp*
- Deleted files:
event.code: "4659"
This way you will be able to view in real time the accesses to files in your company, how you can filter by user and know which files you work with… or filter by file and see who accesses it… Of course we can extend the time range to where we are interested, Make reports, or basically look for the culprit of when someone deletes a file and in the end no one was.
Well, Remember that at the beginning I recommended a post, Give it a refresher that we have a lot of events that we can chase to know when something happens. A huge hug, Enjoy life!!!