Exploiting Elasticsearch visualization in Grafana with Sankey
In this post we will see a very interesting Panel for Grafana, a Sankey-type panel, A way to visualize (with the eyes) data that we have in text and by having a relationship between them, We will exploit them (Elasticsearch logs).
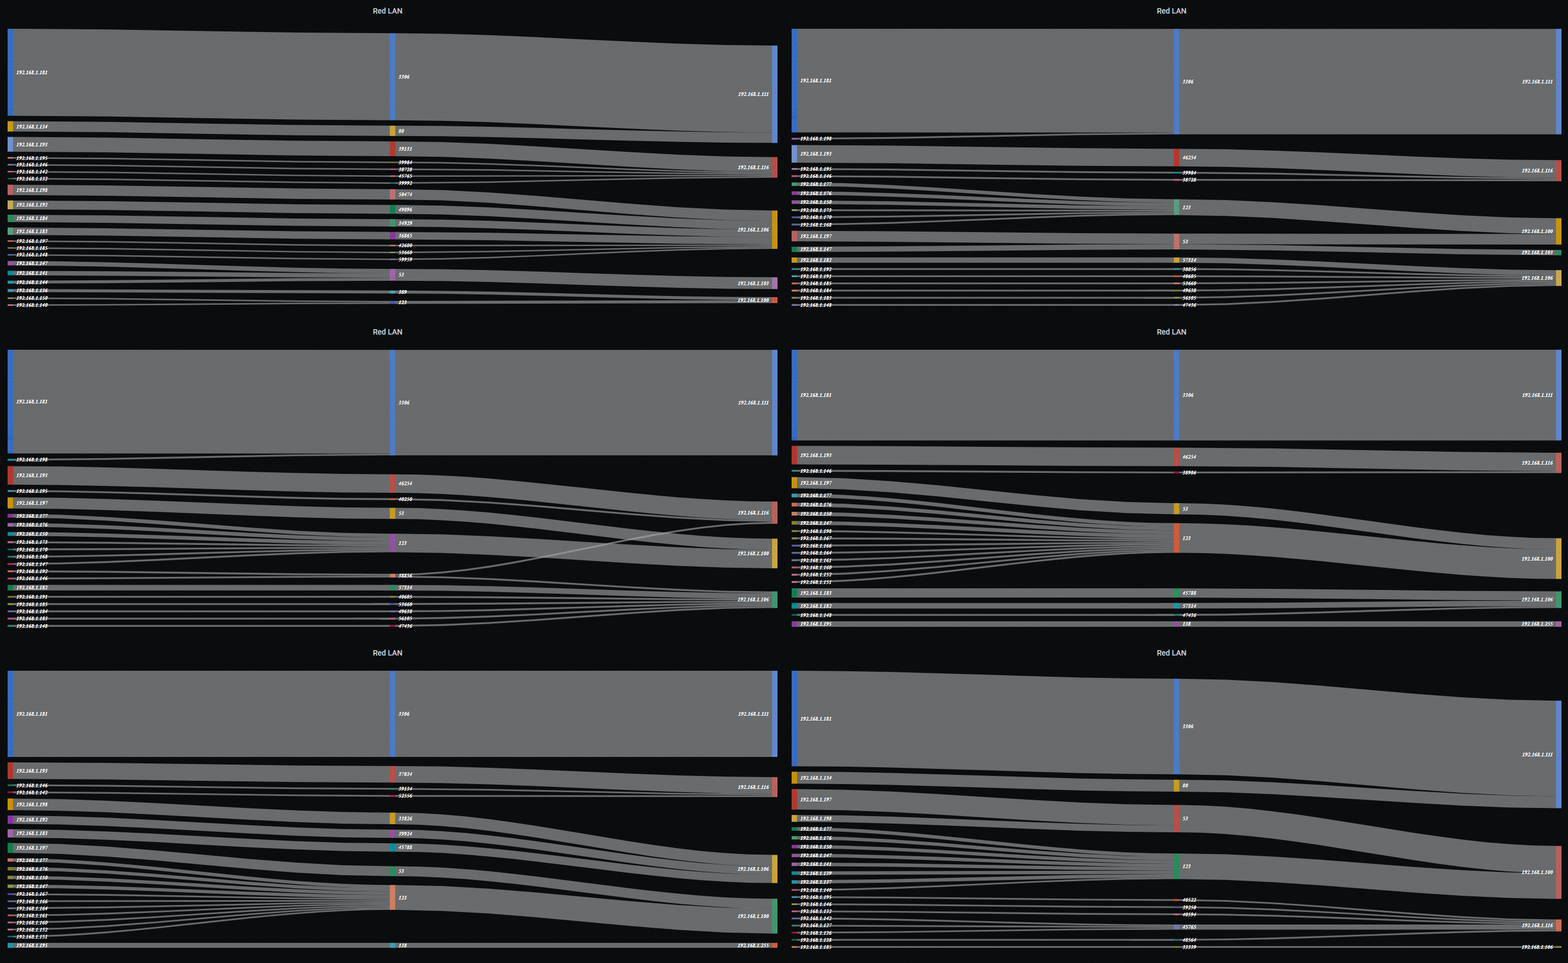
The example we will make in this post, will be to visualize data that we collect in our Elasticsearch, in this case logs of an Apache, an IIS, A firewall… or in particular my IDS & Favorite IPS, Meerkat, where we will see our network connections. Who connects with whom in a visual way (Origins & Destinations), Against which port, The top connections… and thus we will know in a graphic way the behavior of our network.
Well, You'll see that this is sucked, first we will install the wonderful Sankey Panel in Grafana:
cd /var/lib/grafana/plugins/ git clone https://github.com/kumaravel29/sankey-panel.git
We edit this Grafana file '/usr/share/grafana/public/views/index.html’ and on the line 18 Or out there in a little hole, we add:
<script type="text/javascript" src="https://www.gstatic.com/charts/loader.js"></script>
And we restart Grafana:
systemctl restart grafana-server
And we can add a Shankey Panel, we will take into account that at least we will group at least 2 Two Terms, in this example of network log analysis we will use: Source IP Addresses (source.ip) and Destination IPs (destination.ip). As we can see, we will have 1 Metric that can be “Count” (in case we want to see the number of connections) or we can put another one, For example “Sum” and choose a field with bytes such as 'destination.bytes’ and thus we see the sum of consumption and not connections. To the consumer's taste, if we want to see data or connections (among others).
Or as I said, We may group by more Terms, and if we add as in the previous example the Destination Ports (destination.port) we will be able to see not only which IP address it connects to whom, if not also against which port.
And then when we have it, We can exploit this data as we like, View the latest 24 hours, or week, Know how our network behaves… or directly visualize the last minute and have the visualization self-refresh every X seconds, so in real time we can also see what is happening.
As usual, hoping that you find it interesting and you can apply it in your environments to get to know them better, Hugs to tod@s!
