Collecting the LOGs from our DNS and DHCP server in Elasticsearch and visualizing them in Grafana

How unoriginal I am for short titles… Well, if you have your own DNS server or DHCP server, This is your post 😉 We're not really going to get it through logs, we will do this by auditing your traffic 😉 We will audit the requests generated by the DNS service, or DHCP to view it in Grafana!
If we want to know the requests received by our DNS or DHCP server in order to be able to visualize them in Grafana to make queries or arrange them in rotating dashboards… where it helps us to know the correct or not functioning of the same services, as well as to know in the case of the DNS the destination requests, Who performs them… In the case of DHCP, the petitions… Other types of traffic can be analyzed, of course, HTTP, MySQL, PostgreSQL… and thus know the queries that are made…
How do we assemble it? We assume that we already have a functional ELK and a Grafana, we will rely on Packetbeat to analyze the traffic of a given machine, then we will send it to Elasticsearch and with a Grafana Datasource we will be able to make the queries we need.

On Windows, We must install on the machine NPCAP previously, by only checking 'Install Npcap in WinPcap API-compatible Mode'. We continue and finish with the installation of Packetbeat.
Once we have packetbeat downloaded and uncompressed, We'll set it up, as usual, your 'packetbeat.yml' configuration file.
...
setup.template.settings:
  index.number_of_shards: 1
setup.template.name: "packetbeat"
setup.template.pattern: "packetbeat-*"
setup.ilm.enabled: False
...
setup.kibana:
  host: "https://DIRECCION_IP_KIBANA:5601"
  ssl.verification_mode: none
...
output.elasticsearch:
  # Array of hosts to connect to.
  Hosts: ["https://DIRECCION_IP_ELASTIC:9200"]
  ssl.verification_mode: none username: "XXXXXXXX"
  password: "XXXXXXXX*"
  index: "packetbeat-%{+yyyy. MM.dd}"
...
And, In the same configuration file we will need to indicate which records we are interested in auditing:
...
# =========================== Transaction protocols ============================ packetbeat.protocols:
- type: icmp
  # Enable ICMPv4 and ICMPv6 monitoring. The default is true.
  enabled: False

- type: amqp
  # Configure the ports where to listen for AMQP traffic. You can disable
  # the AMQP protocol by commenting out the list of ports.
  ports: [5672]
  enabled: False

- type: cassandra
  # Configure the ports where to listen for Cassandra traffic. You can disable
  # the Cassandra protocol by commenting out the list of ports.
  ports: [9042]
  enabled: False

- type: dhcpv4
  # Configure the DHCP for IPv4 ports.
  ports: [67, 68]

- type: DNS
  # Configure the ports where to listen for DNS traffic. You can disable
  # the DNS protocol by commenting out the list of ports.
  ports: [53]

- type: HTTP
  # Configure the ports where to listen for HTTP traffic. You can disable
  # the HTTP protocol by commenting out the list of ports.
  ports: [80, 8080, 8000, 5000, 8002]
  enabled: False
...
Una vez configurado, We install the service:
cd '.\Program Files\packetbeat\'
.\install-service-packetbeat.ps1
Validamos la configuración, cargamos la config y arrancamos el servicio:
.\packetbeat.exe test config -c .\packetbeat.yml -e
.\packetbeat.exe setup
Start-Service packetbeat
Note, to use less CPU, we should filter only the protocols that interest us, In addition, in the 'packetbeat.interfaces.device' parameter’ set the ID of the network card to audit, to know which ID, in a terminal console we execute: 'packetbeat devices':
packetbeat devices
0: \Device\NPF_{AB47E8CD-2692-4320-A188-FFE1191EDFDC} (Ethernet Adapter vmxnet3) (fe80::70ef:a48d:29b2:3677 192.168.1.100)
1: \Device\NPF_Loopback (Adapter for loopback traffic capture) (Not assigned IP address)
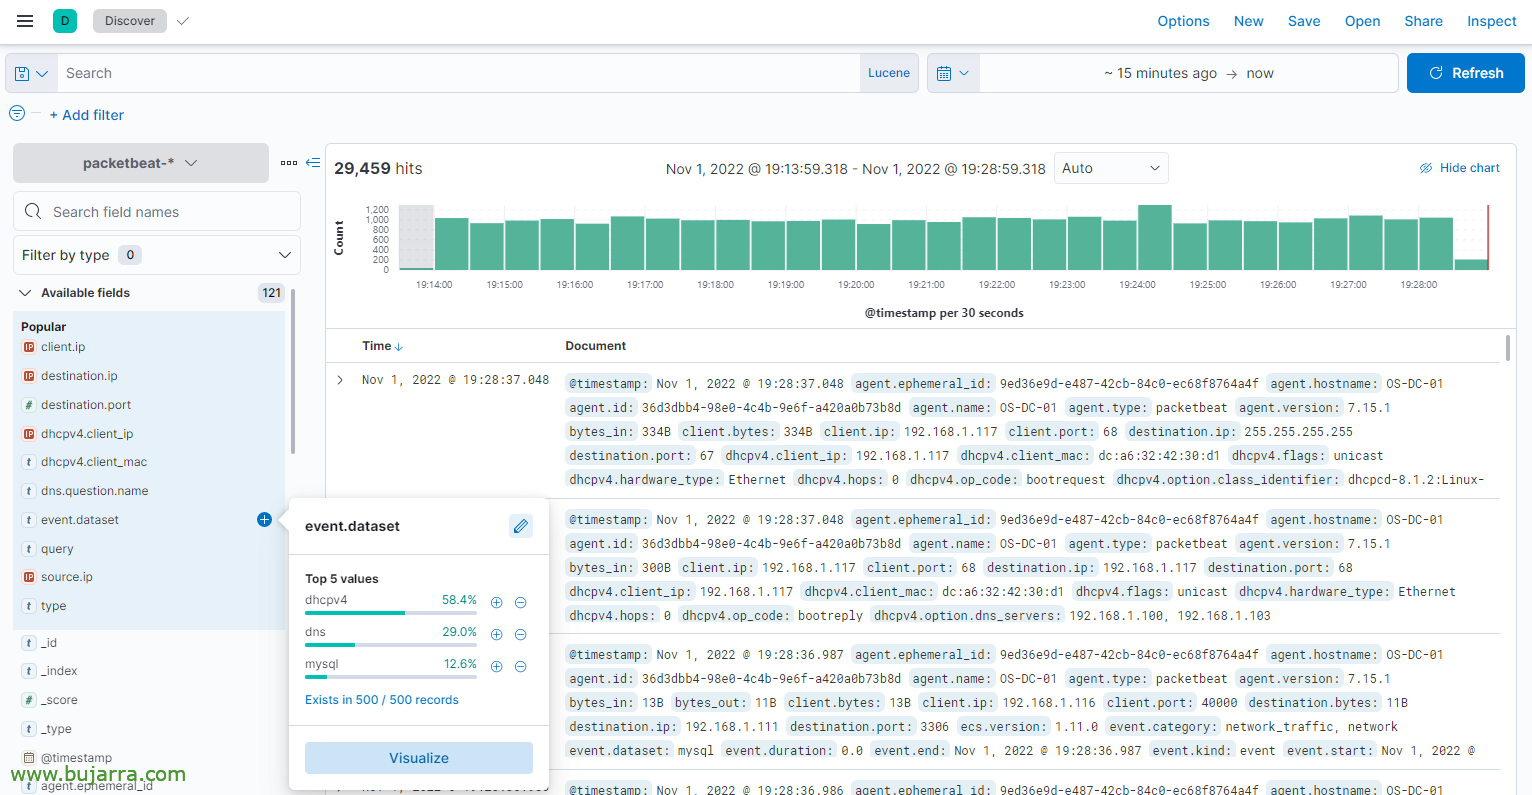
We can check from Kibana if we are already collecting Auditbeat events, we should create the index as usual.

And then, from Grafana we will create a Data Source against this Elasticsearch index and can start creating. Preferably something nicer than mine. A panel, at a glance you can see DNS queries, origin, destiny, top clients, top destinations… and more or less the same with DHCP.
I'm sure you'll improve my dashboard in no time, we can put other types of panels, these are the typical pie charts, Graphic, sankey…

So that we can later do filters and searches DNS by source IP, destination site…
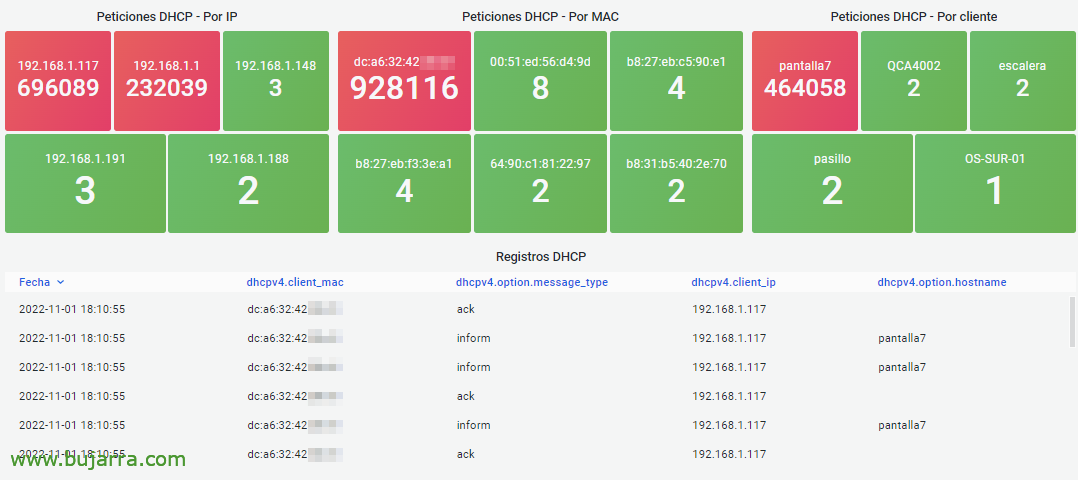
Another way to view DHCP… And yes… I see that I have a Raspberry Pi that has problems with WiFi, it must have a cheap transformer with low voltage…
But, well, in an environment with more data, or more real data you can visualize it in a more attractive way. Come, I won't go on too long, I hope this serves as inspiration if you need to gather data from your DNS server or DHCP server.
A hug to tod@s!