Measuring atmospheric pressure with Raspberry Pi
If we want to know and monitor atmospheric pressure in a cheap way… How could you not… This is your document! We can do it quickly with a Raspberry Pi and a sensor that barely goes beyond the 2 Euros! In this post we will see all the steps you will need to achieve it, Also as always… we will store the measurements in a MySQL database and then we will visualize the values with beautiful graphs thanks to Grafana!
We will use a small BMP180 barometric pressure sensor, with it we can obtain the temperature, atmospheric pressure and even altitude!
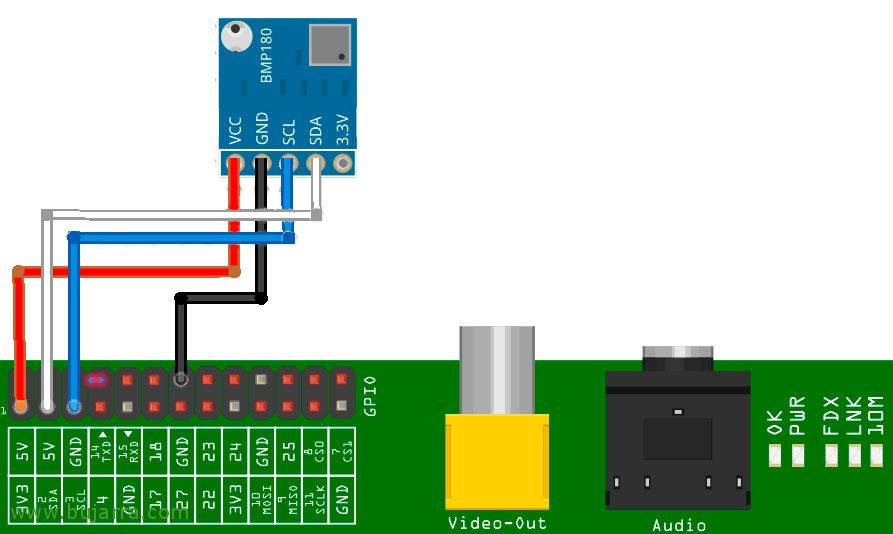
GPIO connection of the BMP180 would be very simple, with the Raspberry Pi obviously turned off, we connect from the BMP180 VCC connection to the Pin 1 (3.3v), GND to a Raspberry Pi Onshore Port, SCL to Pin 5 (GPIO03) or SCL1; and finally the SDA connection will go to the Pin 3 (GPIO02) or Pi SDA1.
We understand that we have a functional Raspberry Pi with Raspbian installed, if we don't have I2C connections enabled, We have to do it by executing
“sudo raspi-config” > We're going to “Interfacing Options”, We enable “I2C” and restart the Raspberry Pi.
And now the wonderful, thanks to Matt Hawkins, we can download its Python script and run it to get the data!!
[SourceCode]wget https://bitbucket.org/MattHawkinsUK/rpispy-misc/raw/master/python/bme280.py
Python bme280.py[/SourceCode]
As we can see this script is for the BME280, which would also have a humidity sensor, The script is fully supported, So great! Now that I said, Everyone must treat the data as they want, as usual, And as you already know, What I usually do is create a scheduled task with cron that executes the script and stores the atmospheric pressure value in a MySQL database, then I see the data with Grafana It's very cool as you know! So if we add this to the end of the script we will be able to store the atmospheric pressure in the DB:
[SourceCode]import sys
import MySQLdb
db = MySQLdb.connect("SERVIDOR_MYSQL","USUARIO","CONTRASEÑA","BASE_DE_DATOS")
cursor = db.cursor()
cursor.execute("""INSERT INTO presion_atmosferica (Pressure) VALUES (%s) """,( pressure))
db.commit()[/SourceCode]
And as always, In case you are interested, I will paste the text you need to create the table exactly as I have it, but it doesn't have any mystery, Has 2 Columns, one to store the pressure and the other the date (that by not allowing NULL it autocompletes every time the pressure value is set):
[SourceCode]CREATE TABLE 'presion_atmosferica' (
'pressure' FLOAT NULL DEFAULT NULL,
'date' TIMESTAMP NOT NULL DEFAULT CURRENT_TIMESTAMP ON UPDATE CURRENT_TIMESTAMP
)
COLLATE='latin1_swedish_ci’
ENGINE=InnoDB
ROW_FORMAT=COMPACT
;[/SourceCode]
And ready in Grafana, in a Dashboard that we have, super easy to add a Graph type panel and customize it to your liking, Spend 5 minutes that Grafana is super intuitive, in my case I have a MySQL connector that connects against the DB and with this Query I have that cool graph:
[SourceCode]SELECT pressure as value, "Presion" as metric, UNIX_TIMESTAMP(date) as time_sec FROM presion_atmosferica WHERE $__timeFilter(date) Order by time_sec ASC[/SourceCode]
List!!! I hope you find it interesting! We already have the atmospheric pressure monitored! Perfect for a weather station or that? Success!


