Collecting Ubiquiti UniFi LOGs in Elasticsearch and Visualizing Them in Grafana

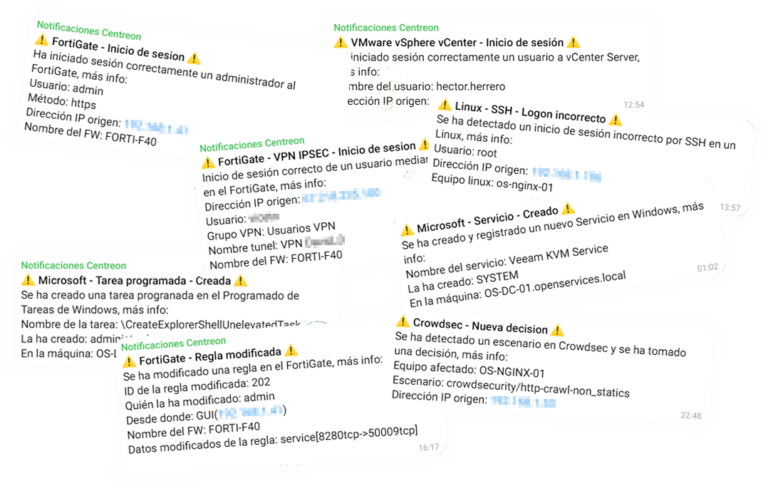
And we continue with more strange things… today the first one of collecting Logs to the Ubiquiti Unifi environment, of our APs, Switches… for the second time we parse., we treat the Logs with Logstash and for dessert we store it in Elasticsearch, and the icing on the cake will be visualizing it with Grafana. All this to control in real time what happens in our communications infrastructure, who is trying to access the Wisfis…
Well, what I said, if we have some Ubiquiti out there providing some service and we want to know what is happening there, who communicates with whom… I was more curious about the WiFi part, View connection attempts, Customer Health… each one will visualize what interests them most. So we'll start by instructing the UniFi console to store the logs in a syslog, our Logstash will send the logs and I will leave you an example file to filter and be able to separate the collected data into interesting fields, that same configuration file will indicate that the information already separated into different fields is stored in an Elasticsearch index. And we will finish with Kibana or Grafana by visualizing in a Dashboard the information that interests us and in the format that interests us.
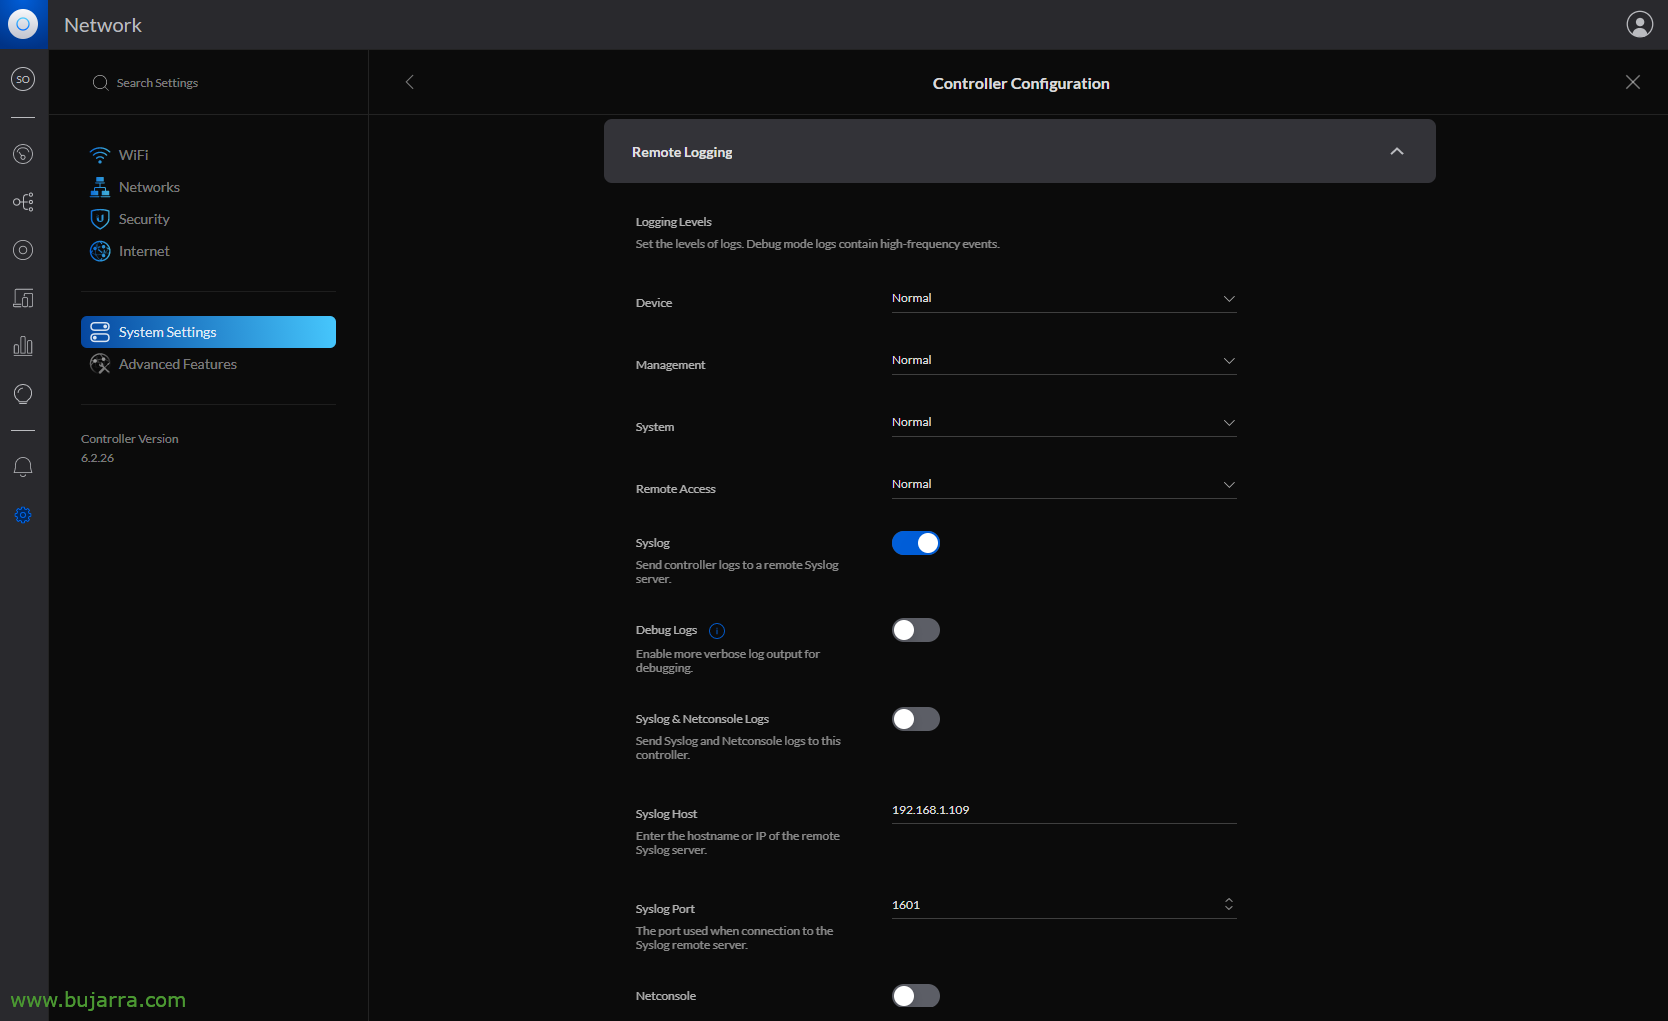
First we obviously have to have the Elastic Stack part installed, What has been Logstash, Elasticsearch and Kibana; Then we enable the remote syslog from the UniFi Controller console > “Settings” > “System Settings” > “Controller Configuration” > “Remote Logging”, and only enabling the Syslog part is enough for us, without Netconsole. We indicate the IP address of our Logstash and an unused random port where it will send the Logs.
Input {
        UDP {
                type => "UniFi"
                port => "1601"
                tags => ["UniFi"]
        }
}

filter {

        if [type] == "UniFi" {
                        Grok {
                            match => { "Message" => [
                              "^<%{POSINT:syslog_pri}>%{SYSLOGTIMESTAMP:syslog_timestamp} %{WORD:UniFi_MAC},%{GREEDYDATA:UniFi_Firmware}: %{PROG:Proceso_nombre}: \[%{NUMBER:Proceso_pid}\] \[%{DATE:Proceso_tarea}\] DNS request timed out; \[STA: %{COMMONMAC:Cliente_MAC}\]\[QUERY: %{GREEDYDATA:Cliente_consulta}\] \[DNS_SERVER :%{IPV4}\] \[TXN_ID %{DATE:Txn_id}\] \[REPORT %{NUMBER:Cliente_puerto_origen}\]",
                              "^<%{POSINT:syslog_pri}>%{SYSLOGTIMESTAMP:syslog_timestamp} %{WORD:UniFi_MAC},%{GREEDYDATA:UniFi_Firmware}: %{PROG:Proceso_nombre}: \[%{NUMBER:Proceso_pid}\] \[%{DATE:Proceso_tarea}\] %{GREEDYDATA:Message}",
                              "^<%{POSINT:syslog_pri}>%{SYSLOGTIMESTAMP:syslog_timestamp} %{WORD:UniFi_MAC},%{GREEDYDATA:UniFi_Firmware}: : %{PROG:Proceso_nombre}\[%{NUMBER:Proceso_pid}\]: wireless_agg_stats.log_sta_anomalies(\): bssid=%{COMMONMAC:BSSID_MAC} Radius=%{WORD:BSSID_radio} VAP=%{WORD:vap} sta=%{COMMONMAC:Cliente_MAC} satisfaction_now=%{NUMBER:Cliente_satisfaccion} anomalies=%{GREEDYDATA:Cliente_anomalia}",
                              "^<%{POSINT:syslog_pri}>%{SYSLOGTIMESTAMP:syslog_timestamp} %{WORD:UniFi_MAC},%{GREEDYDATA:UniFi_Firmware}: : %{PROG:Proceso_nombre}\[%{NUMBER:Proceso_pid}\]: \[%{DATE:Proceso_tarea}\].stahtd_dump_event(\): \{\"query_%{NUMBER:Consulta_id}\":\"%{HOSTNAME:Consulta_FQDN}\",\"mac\":\"%{COMMONMAC:Cliente_MAC}\",\"message_type\":\"%{DATE:Mensaje_tipo}\",\"query_server_%{NUMBER:Consulta_id}\":\"%{IPV4:IP_servidor}\",\"assoc_status\":\"%{NUMBER:Asociacion_estado}\",\"vap\":\"%{WORD:vap}\",\"event_type\":\"%{DATE:Evento_tipo}\"\}",
                              "^<%{POSINT:syslog_pri}>%{SYSLOGTIMESTAMP:syslog_timestamp} %{WORD:UniFi_MAC},%{GREEDYDATA:UniFi_Firmware}: : %{PROG:Proceso_nombre}\[%{NUMBER:Proceso_pid}\]: \[%{DATE:Proceso_tarea}\].stahtd_dump_event(\): \{\"dns_resp_seen\":\"%{WORD:DNS_resp_seen}\",\"message_type\":\"%{DATE:Mensaje_tipo}\",\"mac\":\"%{COMMONMAC:Cliente_MAC}\",\"vap\":\"%{WORD:vap}\",\"assoc_status\":\"%{NUMBER:Asociacion_estado}\",\"event_type\":\"%{DATE:Evento_tipo}\",\"event_id\":\"%{NUMBER:Evento_id}\",\"arp_reply_gw_seen":\"%{WORD:ARP_resp_seen}\",\"auth_ts\":\"%{NUMBER:Auth_ts}\"\}",
                              "^<%{POSINT:syslog_pri}>%{SYSLOGTIMESTAMP:syslog_timestamp} %{WORD:UniFi_MAC},%{GREEDYDATA:UniFi_Firmware}: : %{PROG:Proceso_nombre}\[%{NUMBER:Proceso_pid}\]: \[%{DATE:Proceso_tarea}\].stahtd_dump_event(\): \{\"query_server_%{NUMBER:Consulta_id}\":\"%{IPV4}\",\"query_%{NUMBER:Consulta_id}\":\"%{HOSTNAME:Consulta_FQDN}\",\"mac\":\"%{COMMONMAC:Cliente_MAC}\",\"message_type\":\"%{DATE:Mensaje_tipo}\",\"assoc_status\":\"%{NUMBER:Asociacion_estado}\",\"vap\":\"%{WORD:vap}\",\"event_type\":\"%{DATE:Evento_tipo}\"\}",
                              "^<%{POSINT:syslog_pri}>%{SYSLOGTIMESTAMP:syslog_timestamp} %{WORD:UniFi_MAC},%{GREEDYDATA:UniFi_Firmware}: : %{PROG:Proceso_nombre}\[%{NUMBER:Proceso_pid}\]: \[%{DATE:Proceso_tarea}\].stahtd_dump_event(\): \{\"query_server_%{NUMBER:Consulta_id}\":\"%{IPV4}\",\"mac\":\"%{COMMONMAC:Cliente_MAC}\",\"message_type\":\"%{DATE:Mensaje_tipo}\",\"vap\":\"%{WORD:vap}\",\"%{DATE:Evento_tipo}\",\"query_%{NUMBER:Consulta_id}\":\"%{HOSTNAME:Consulta_FQDN}\",\"assoc_status\":\"%{NUMBER:Asociacion_estado}\"\}",
                              "^<%{POSINT:syslog_pri}>%{SYSLOGTIMESTAMP:syslog_timestamp} %{WORD:UniFi_MAC},%{GREEDYDATA:UniFi_Firmware}: : %{PROG:Proceso_nombre}\[%{NUMBER:Proceso_pid}\]: \[%{DATE:Proceso_tarea}\].stahtd_dump_event(\): \{\"mac\":\"%{COMMONMAC:Cliente_MAC}\",\"message_type\":\"%{DATE:Mensaje_tipo}\",\"assoc_status\":\"%{NUMBER:Asociacion_estado}\",\"vap\":\"%{WORD:vap}\",\"event_type\":\"%{DATE:Evento_tipo}\":\"%{NUMBER:Evento_id}\"\}",
                              "^<%{POSINT:syslog_pri}>%{SYSLOGTIMESTAMP:syslog_timestamp} %{WORD:UniFi_MAC},%{GREEDYDATA:UniFi_Firmware}: : %{PROG:Proceso_nombre}\[%{NUMBER:Proceso_pid}\]: \[%{DATE:Proceso_tarea}\].stahtd_dump_event(\): \{\"mac\":\"%{COMMONMAC:Cliente_MAC}\",\"message_type\":\"%{DATE:Mensaje_tipo}\",\"vap\":\"%{WORD:vap}\",\"query_server_%{NUMBER:Consulta_id}\":\"%{IPV4}\",\"event_type\":\"%{DATE:Evento_tipo}\",\"assoc_status\":\"%{NUMBER:Asociacion_estado}\",\"query_%{NUMBER:Consulta_id}\":\"%{HOSTNAME:Consulta_FQDN}\"\}",
                              "^<%{POSINT:syslog_pri}>%{SYSLOGTIMESTAMP:syslog_timestamp} %{WORD:UniFi_MAC},%{GREEDYDATA:UniFi_Firmware}: : %{PROG:Proceso_nombre}\[%{NUMBER:Proceso_pid}\]: \[%{DATE:Proceso_tarea}\].stahtd_dump_event(\): \{\"dns_resp_seen\":\"%{WORD:DNS_resp_seen}\",\"mac\":\"%{COMMONMAC:Cliente_MAC}\",\"message_type\":\"%{DATE:Mensaje_tipo}\",\"assoc_status\":\"%{NUMBER:Asociacion_estado}\",\"vap\":\"%{WORD:vap}\",\"event_type\":\"%{DATE:Evento_tipo}\",\"event_id\":\"%{NUMBER:Evento_id}\",\"auth_ts\":\"%{NUMBER:Auth_ts}\"\}",
                              "^<%{POSINT:syslog_pri}>%{SYSLOGTIMESTAMP:syslog_timestamp} %{WORD:UniFi_MAC},%{GREEDYDATA:UniFi_Firmware}: : %{PROG:Proceso_nombre}\[%{NUMBER:Proceso_pid}\]: \[%{DATE:Proceso_tarea}\].stahtd_dump_event(\): \{\"dns_resp_seen\":\"%{WORD:DNS_resp_seen}\",\"message_type\":\"%{DATE:Mensaje_tipo}\",\"mac\":\"%{COMMONMAC:Cliente_MAC}\",\"ip_assign_type\":\"%{DATE:Tipo_asignacion_ip}\",\"vap\":\"%{WORD:vap}\",\"assoc_status\":\"%{NUMBER:Asociacion_estado}\",\"event_type\":\"%{DATE:Evento_tipo}\",\"auth_ts\":\"%{NUMBER:Auth_ts}\",\"wpa_auth_delta\":\"%{NUMBER:WPA_auth_delta}\",\"assoc_delta\":\"%{NUMBER:Assoc_delta}\",\"auth_delta\":\"%{NUMBER:Auth_delta}\",\"event_id\":\"%{NUMBER:Evento_id}\"\}",
                              "^<%{POSINT:syslog_pri}>%{SYSLOGTIMESTAMP:syslog_timestamp} %{WORD:UniFi_MAC},%{GREEDYDATA:UniFi_Firmware}: %{PROG:Proceso_nombre}: %{WORD:vap}: STA %{COMMONMAC:Cliente_MAC} %{DATE:Proceso_tarea}: %{GREEDYDATA:Message}",
                              "^<%{POSINT:syslog_pri}>%{SYSLOGTIMESTAMP:syslog_timestamp} %{WORD:UniFi_MAC},%{GREEDYDATA:UniFi_Firmware}: : %{PROG:Proceso_nombre}\[%{NUMBER:Proceso_pid}\]: wevent.ubnt_custom_event\(\): %{DATE:Evento_tipo} %{WORD:vap}: %{COMMONMAC:Cliente_MAC} / %{IPV4:Cliente_ip}",
                              "^<%{POSINT:syslog_pri}>%{SYSLOGTIMESTAMP:syslog_timestamp} %{WORD:UniFi_MAC},%{GREEDYDATA:UniFi_Firmware}: : %{PROG:Proceso_nombre}\[%{NUMBER:Proceso_pid}\]: wevent.ubnt_custom_event\(\): %{DATE:Evento_tipo} %{WORD:vap}: %{COMMONMAC:Cliente_MAC} / %{NUMBER:Evento_id}",
                              "^<%{POSINT:syslog_pri}>%{SYSLOGTIMESTAMP:syslog_timestamp} %{WORD:UniFi_MAC},%{GREEDYDATA:UniFi_Firmware}: : %{PROG:Proceso_nombre}\[%{NUMBER:Proceso_pid}\]: %{GREEDYDATA:Message}",
                              "^<%{POSINT:syslog_pri}>%{SYSLOGTIMESTAMP:syslog_timestamp} %{WORD:UniFi_MAC},%{GREEDYDATA:UniFi_Firmware}: %{PROG:Proceso_nombre}: %{DATE:Proceso_tarea}\[%{NUMBER:Proceso_pid}\]: %{GREEDYDATA:Task}: %{GREEDYDATA:Message}",
                              "^<%{POSINT:syslog_pri}>%{SYSLOGTIMESTAMP:syslog_timestamp} %{WORD:UniFi_MAC},%{GREEDYDATA:UniFi_Firmware}: %{PROG:Proceso_nombre}: %{DATE:Proceso_tarea} %{COMMONMAC:Cliente_MAC} %{WORD:vap} \(%{GREEDYDATA:Message}\)",
                              "^<%{POSINT:syslog_pri}>%{SYSLOGTIMESTAMP:syslog_timestamp} %{WORD:UniFi_MAC},%{GREEDYDATA:UniFi_Firmware}: %{UNIXPATH:Proceso_nombre}\[%{NUMBER:Proceso_pid}\]: %{GREEDYDATA:Message}",
                              "^<%{POSINT:syslog_pri}>%{SYSLOGTIMESTAMP:syslog_timestamp} %{WORD:UniFi_MAC},%{GREEDYDATA:UniFi_Firmware}: %{PROG:Proceso_nombre}: \[%{NUMBER:Proceso_pid}\] %{GREEDYDATA:Message}",
                              "^<%{POSINT:syslog_pri}>%{SYSLOGTIMESTAMP:syslog_timestamp} %{WORD:UniFi_MAC},%{GREEDYDATA:UniFi_Firmware}: %{PROG:Proceso_nombre}: %{DATE:Proceso_tarea}: %{GREEDYDATA:Message}"
                                       ]
                            }
                        }

                        Mute {
                          convert => {
                            "Cliente_satisfaccion" => "Integer"
                          }
                        }
        }
}

output {

        if ([type]=="UniFi"){

                ElasticSearch {
                   index => "unifi-%{+YYYY. MM.dd}"
                   hosts=> "DIRECCION_IP_ELASTICSEARCH:9200"
                }

        }
}
Continue, necesitamos crear un fichero en Logstash para ingestar, Transform and send data. Primero escucharemos en el puerto TCP indicado en UniFi que vimos en el paso anterior; second, tratar los logs que recibe y separarlos en distintos campos para ser por último almacenados en nuestro Elasticsearch. So let's create for example the configuration file '/etc/logstash/conf.d/unifi.conf', We will continue with the filters, I did my grok as best I could, I apologize to the wise men on the subject, but totally valid to collect the Logs of the Ubiquiti UniFi with version 6.2.x. In the end, in the output we'll output our Elasticsearch, Remember to enter username & password that mine is a LAB and I love the worst practices… And really forgive the real gurus my groks, I'm still in 1st of filters.

Once the configuration file has been created, remember to restart the Logstash service to reload the new config. Afterwards as always, we will go to Kibana and once the data is coming in we can go to "Management" > "Stack management" > "Kibana" > "Index Patterns" > "Create index pattern" to create the index pattern, As I said, as usual (in this case and without the quotation marks) 'unifi-*' and we will have the data already stored in Elasticsearch correctly. We could now connect from "Discover" to our Ubiquiti UniFi index to visualize that it is collecting data.

And we end up as always in Grafana! TCreating the index in Kibana, now in our beloved Grafana we should create a "Data Source" that targets our Elasticsearch and the UniFi index. Then it's letting your imagination run wild, make a Dashboard with different Dashboards, with different data to visualize, Graphics with customer satisfaction/connection quality, one World Map with incoming/outgoing connections, One of Style Sankey to view client IPs/APs, in column format, in stalemate to view specific data on e.g. successful accesses, Incorrect, the connections...
As usual, trying to inspire or help, if you improve it you 😉 pass it on to me With this we can see what happens in our(s) Ubiquiti devices, at Access Points, on the Switches, in real time, Putting an automatic refresh every 10 seconds is very impressive, It will also help us to analyze the summary of the last 24 hours, or knowing when something strange happens... like the neighbor trying to connect.. As usual, Thank you all and much more to those who move this type of content on social networks  Hehe, hugs!