Nagios – Monitoring Windows Counters

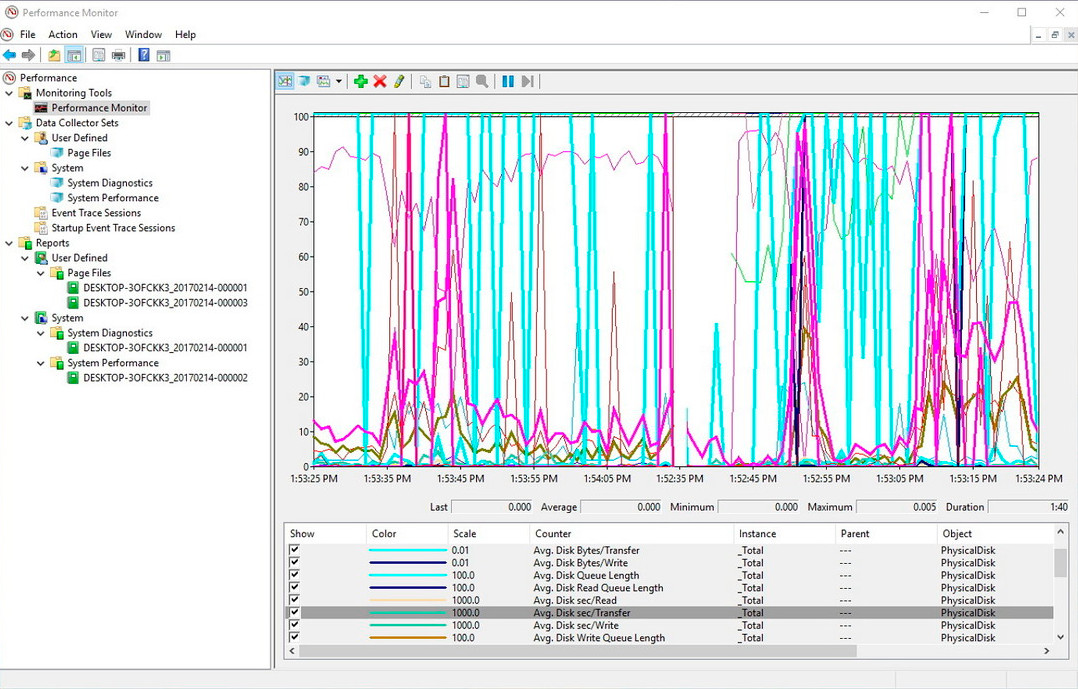
Something super useful is that thanks to Nagios, we will be able to monitor any performance counter of a Windows machine, Yes, any! We just need to know which one! We all know that the Performance Monitor of a Windows is super powerful and we have counters that allow us to analyze any parameter that we surely need. We can take this and centralize it to monitor from Nagios / Centreon.
We will be based on a script that is already available on our machines with Nagios and Centreon, The famous check_nt, than to be able to use it, we must have the NSClient++ agent installed on the Windows machine to which we will make the query, if you don't have it installed, Check out This document First of all. We will create a Command first where we will define what will execute against Windows and then all the Services that we need to monitor for each Performance Monitor that we inspect. With this we will avoid using the Performance Monitor to analyze performances, since everything is now recorded in our monitoring appliance.

From Centreon, We're going to “Configuration” > “Services” and we clone an existing one that we will modify or add a new one from “Add…”, We must fill in the fields that it asks us to do as follows:
- Command Name: It will be the name of the command, to identify it in the future, it will be necessary to indicate a name that associates it with us, how we will use check_nt and with this we will only look at the performance counters, something like 'check_nt_counter’ It will be good for us.
- Command Type: We mark 'Check'.
- Command Line: It will be what this Command executes when it is called, So we enter the command that will execute followed by the necessary arguments, In my case I use the default port 12489 and at the end I indicate the password that the 'nsclient.ini’ of Windows computers (In my case I have: password = bTX1xIjO7aAzrESc) so it should look something like this:
[SourceCode]$USER1$/check_nt -H $HOSTADDRESS$ -p 12489 -v COUNTER -l $ARG 1$ -w $ARG 2$ -c $ARG 3$ -s bTX1xIjO7aAzrESc[/SourceCode]
Click on “Describe arguments” and we define the ARGx that will be the information that we enter when creating the Services and this will give us a clue of what needs to be filled in, in this case it would look like this:
[SourceCode]ARG1 : Counter in format –> "\\Terminal Services\\Sesiones activas","Sesiones Activas %.f"
ARG2 : Warning
ARG3 : Critical[/SourceCode]

And all that remains is to create the Services that will monitor each Performance Counter, We can measure what has been said, any performance monitor we need, it's just opening the Windows tool and seeing what performance counters that machine has installed, therefore we could see those who have installed additional software such as SQL, Oracle, Veeam… Let's go anyone! In addition to the hundreds that the system has. Let's create an example one, we see how to monitor the Active Sessions that a Remote Desktop server has, It will always be interesting to know how many users log in to each server to see swings, Performance Comparisons… and why not also add inactive or disconnected sessions, which are when they are not working but consume resources on the computer and hey, maybe we are interested in removing this. Well, Let's go to Centreon > “Configuration” > “Services” and we added a new one from “Add”, we complete the following:
- Description: It will be the name of the Service that our eyes will see when an alert arrives or we see what is being monitored, in this case something like 'RDP – Active Sessions’ I think he makes it clear.
- Service Template: As I always tell you, This will depend on each one, if we have a base template from which it will inherit a certain generic configuration, In my case the 'generic-service’ has custom notifications, So I apply it.
- Check Command: Select from the combo the Command that we have created in the previous step, it will be 'check_nt_counter’
- Args: We complete the arguments that he asks us, will be the ones we have defined before, that is, the counter to be monitored and the values with which it will warn us of Warning and Critical. In this case I have “\\Terminal Services\Active Sessions”,”Active Sessions %.f” as an argument (in that format, that you get when you add the counter to the performance monitor, That guides you). Note that the Windows operating system may be in English, so perhaps we should put “\\Terminal Services\Active sessions”,”Active sessions %.f” or if we want to add the Inactive ones it would be with “\\Terminal Services\Idle Sessions”,”Idle Sessions %.f”. But what has been said, we see that in every Windows, in your Performance Monitor console, when adding the Specific Counter.
We record with “Save”,

Nothing, and the usual, once we save the Centreon configuration and the services are exported and restarted, we can go to the initial view of the monitoring and visualize that we already have interesting counters added!
I recommend you take a walk around a Windows machine, open its Performance Monitor and see all the counters your server has, Add all the ones you want to monitor and you can have everything you need monitored at all times!!!