Monitoring DNS queries
Something that does not cost much to monitor and can save us from some scares may be to control that a DNS server fulfills its function and can resolve DNS queries. That and also ensuring that our importing FQDNs exist,

Something that does not cost much to monitor and can save us from some scares may be to control that a DNS server fulfills its function and can resolve DNS queries. That and also ensuring that our importing FQDNs exist,
Can you imagine yourself in your data center?, or, Walking around the company, By scanning QR codes? on stickers on your monitored devices and, That you can see in real time their data, Status or Performance? A free app, It's free software, that integrates with your Centreon! ¡What else!
Something very simple and very useful can be and know the latency to different IP addresses, We can visualize in real time, with soft drink 1 second, the times it takes for IP addresses to respond, they may be private or public; For example, to find out if we have problems with the Internet and where they are, For example 🙂
Well, I guess all of you have been getting like mushrooms Docker containers, ¿No? If even a dinosaur like me has a plague of them… Well, and, apart from enjoying them, if we use Centreon as a monitoring system for our organization, ya sabemos, to monitor them!
Surely more than one of us has some service in clustering, but, How do we monitor this with Centreon?? That is, Know that the cluster offers its service because its members offer it.
For monitoring lovers, For lovers of operational visibility, For lovers of having everything under control… Comes… Monitoring with Centreon – Part II in a podcast for YOU, where we will talk about visualizations and business!
Come on, go, that we hadn't given to Centreon for a while; today a classic, But well. If we have any Microsoft SQL Server services in our organization, We can't let it go, apart from your availability, we must know its performance!
In this post we are going to try to see how to visualize any performance metric of a Windows Server computer or its services such as SQL Server, Exchange… with the intention of being able to visualize them in real time in Grafana.
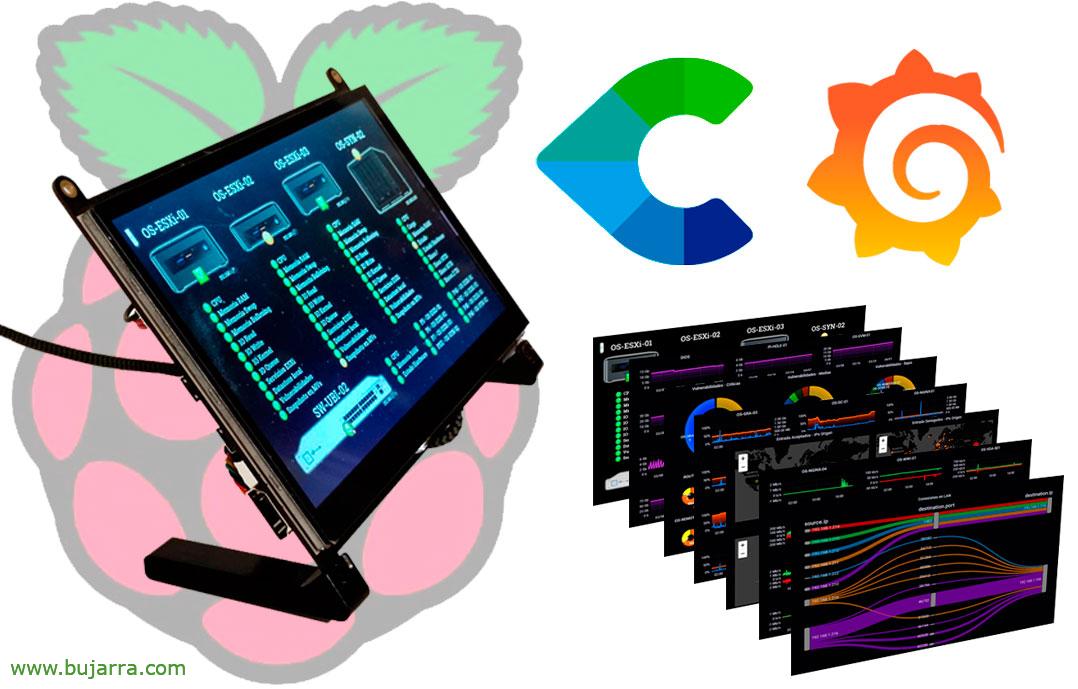
If you have a monitoring environment, This may still be your next step; And it's no more about having a tiny 7-inch screen″ at our desk, Something cute and geeky at the same time. Something that helps us to see in real time the state of our organization thanks to monitoring and operational visibility, 😎 I said .
The only good thing about Mondays, ¿What is it? ¡Effectively! There's a new podcast on “A Podcast for IT”, and this time we will talk about TIG, by Telegraf, of InfluxDB and Grafana… oh how beautiful, A talk on advanced real-time monitoring, Visualization and exploitation of metrics…
Do Tailor-made training
Windows Server – VMware vSphere – Citrix Virtual Apps & Desktops – Centreon


|
|
¡Let's work together!
|
 |
We are a consulting firm that cares and pampers
|
 |
|
With quality and added value
|
 |