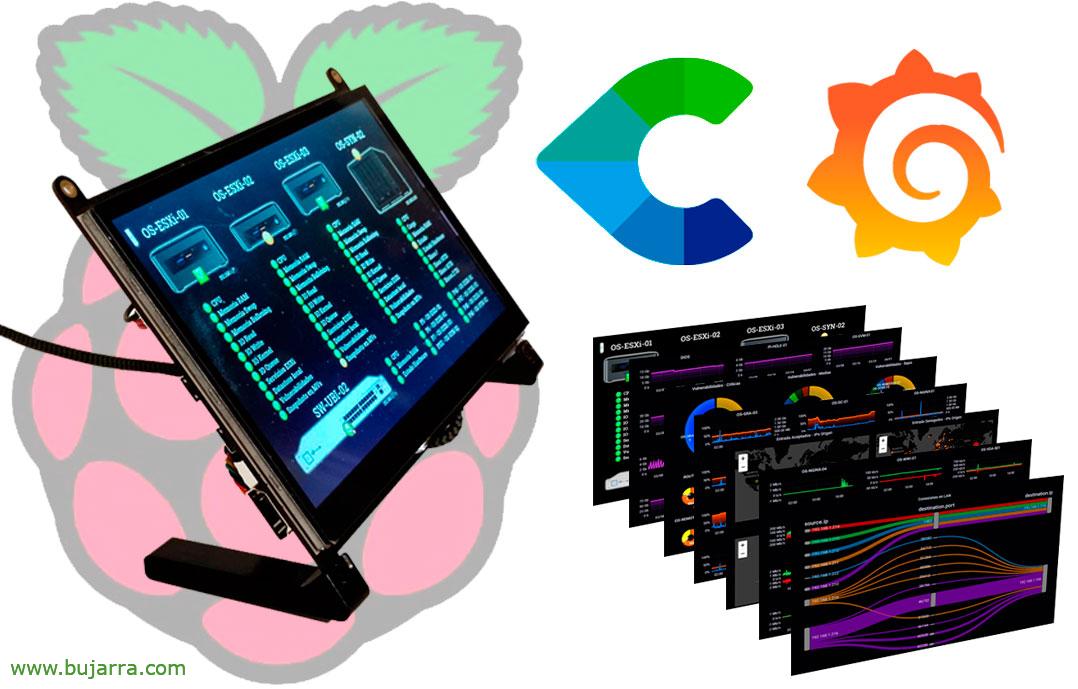
7 Screen″ for helpdesk and monitoring with Raspberry Pi

If you have a monitoring environment, This may still be your next step; And it's no more about having a tiny 7-inch screen″ at our desk, Something cute and geeky at the same time. Something that helps us to see in real time the state of our organization thanks to monitoring and operational visibility, 😎 I said .

I finally decided to write this post, The truth is that it does not have technical content that I think you will appreciate, but I have been working like this for years and maybe it may be of interest to someone. A 7-inch screen″ I think it's a perfect size (if you have good eyesight or glasses) and that doesn't take up space, with a Rasbperry Pi bolted on its back that will prevent having or seeing cables, only 1, 5V Power. There are many models, with or without housing, Personally I like something naked better, But nice, you know what the blog is about The one 😉 I use also has built-in speakers, Where how can I not, You can send him audio if you want, be the radio, integrations with Home Assistant for home automation or with Centreon itself and that any alert that exists in your Hosts or Services sings through the speakers. And the subject is very simple, But as I've ever been asked to… I tell you. The Raspberry Pi when it starts up, A browser starts in kiosk mode and then some pools of images rotate, are from NagVis, by Grafana… where you can graphically see the current state of the components, or the metrics you want to see, go.

Well, you see how cute, ¿No? It doesn't take up anything, consumes nothing… In the end a Raspberry Pi is enough 3 even a 2 that you have lying around in a drawer. What we need is nothing more than to install an operating system, usually 'Raspberry Pi OS with desktop’ the old Raspbian 🙂 but with a desk. So what we will do is very easy, that when starting the Rasperry Pi, it will automatically logon and open a browser against the URL that interests us and we have a pool of images or Playlist, whatever we want to call it, something that rotates every X seconds to different Dashboard. In my case I use both NagVis pools, Centreon as by Grafana, that will show me data center health metrics, Log Viewing, or any other type of visual map.
To instruct the Raspberry Pi to open a browser after starting the graphics session, we configure it by editing '/etc/xdg/lxsession/LXDE-pi/autostart’ and adding a line to that effect:
/usr/bin/firefox-esr --kiosk https://FQDN_GRAFANA:3000/playlists/play/3?Kiosk
We can do this with any browser, in this case we use Firefox ESR, We pass the parameter 'Kiosk’ so that it is seen in full screen followed by the URL and remember to enter if it is Grafana the argument '?kiosk'.

If you're interested in receiving sound alerts, because it depends on which. If you want to receive alerts from Centreon you will have to install festival at the Raspberry Pi, configure SSH fingerprint and configure a Notification Command for the Hosts and another for the Services (in “Configuration” > “Commands” > Notifications”). With the following command lines:
- Services
SSH pi@FQDN_RASPBERRY'/Home/PI/textoAvoz.sh "Attention. In $HOSTNAME$. Service $SERVICEDESC$. is in $SERVICESTATE$ status"'
- Hosts
SSH pi@FQDN_RASPBERRY'/Home/PI/textoAvoz.sh "Attention. The host $HOSTNAME$. You are in $HOSTSTATE$ status"'
And if you happen to have a Home Assistant lying around, that not only serves us for home automation, if not for the company's as well, Automations, consumption… it would be as simple as installing the SnapCast client and you can send them notifications or the radio, or Spotify… And if you have a microphone and you want it to be your Google Home and give you instructions… What if… Come on, I'm already shut up, There are so many possibilities, as much as imagination and I don't want to bore you.

And that's it, Callisto! Here are some screenshots of examples of more kuki things that can be visualized, this is already to the consumer's taste, Sorry for the resolution, but it's what the 7-inch screen uses″. A map of the state of the physical environment from NagVis,

Network interface status of some machines in the last 6h…

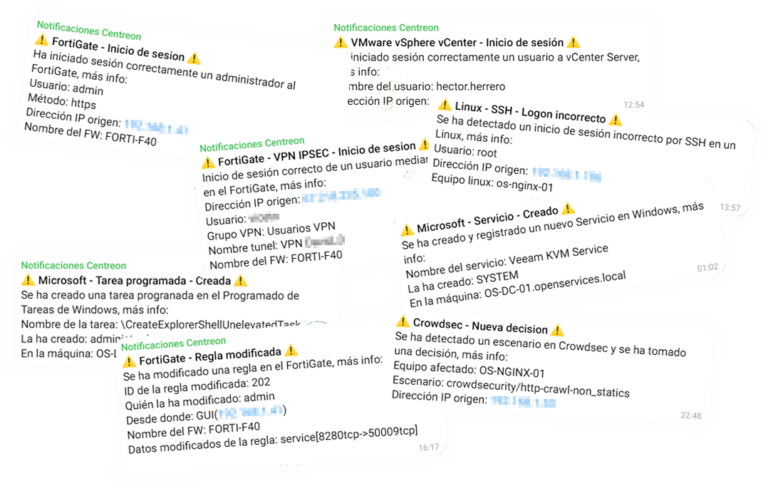
Fortigate Maps, of denied or undenied access, Output and Input… In the end, it's a matter of starting and gradually developing the dashboards that you are interested in seeing, or maybe not so technical…

Controlling the growth of hard drives in the last week… And you can tell that one day I deleted logs in the OTRS 🙂

CPU and RAM usage metrics for certain machines, I think the last ones are also 6 hours. I leave you these Dashboards for you to get ideas, The truth is that they can be greatly improved, I'm sure you would do better,

View vulnerabilities detected on certain machines in your environment, Reviews, Half, Low… I remind you of one of you if you are interested The post where how we may collect them.

Graphics of all kinds, in these we visualize the real-time status of Fortigate, The last 5 minutes I think I remember and that's what, we see CPU consumption, RAM, Sessions, Interface Traffic, internal latencies or to Google… We will see this Dashboard shortly published on the blog.

Did I tell you that I love the Sankeys? This shows the connections of the LAN network, Displays the source and destination machines and the connection port, in this case I think it is the last 5 minutes. I recommend you take a look at Meerkat, It's wonderful.

I'm already stopping with this one, Log collection, Viruses Detected, IDS that detects malware, exploits… What do I insist, it is simply to show you the possibility that having a little gadget of this caliber on the table gives us, It's cheap and everyone will put what they want to see on the screen.
It is different or perhaps more comfortable not to have a TV or a large monitor dedicated to this function, You got it close and come on, goes, He's very geeky!!! I accept it, but also a cutie! I hope you found it interesting and thank you very much if you have come this far, Send you a huge hug!
PS: As you have noticed, I have not recommended any screen model, I think this is to taste, If you have any questions, contact 🙂 me
Being happy,