Using NagVis

Very good! If you feel like drawing and taking your monitoring to a new dimension, This is your document! With NagVis we can have fully customized real-time status maps! We will design maps that help us detect problems, to document our platform, Interconnectivity maps, both LAN and WAN… maps that we will make with Visio or PhotoShop and we will easily make them come to life!
If you don't have NagVis installed, Check out This document And in a few minutes you will have it assembled and you can start to give another perspective to this. We will be able to have a great television in our IT department, where with a pool of images that will rotate we will see and demonstrate to whoever comes to visit us how we have our platform under control. If we draw elegantly we will be able to impress, You'll see!!! It is more about thinking about what maps we want and capturing them to bring them to life, Be as I said, both connectivity between switches, SMTP Traffic, photos of the DPC, Visio drawings of the rack or physical elements, Logical drawings of functions and dependencies…
Creating a map,

First of all, first of all it will be to make the drawing we want to give life to, It must be an image with good quality and image resolution that we will adapt to the screen where we will see it, which will normally be 1080p. In this example, we will create a Map so that at a glance we can know the status of our VMware virtual platform, the image is photoshopped and saved as JPG.
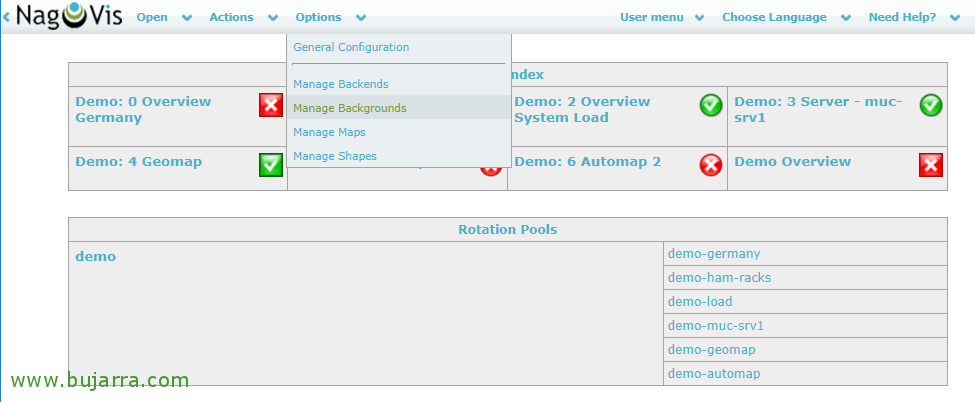
Well, if we enter NagVis, As I said, Before you create a map, We will upload the background image that we will use. “Option” > “Manage Backgrounds”,
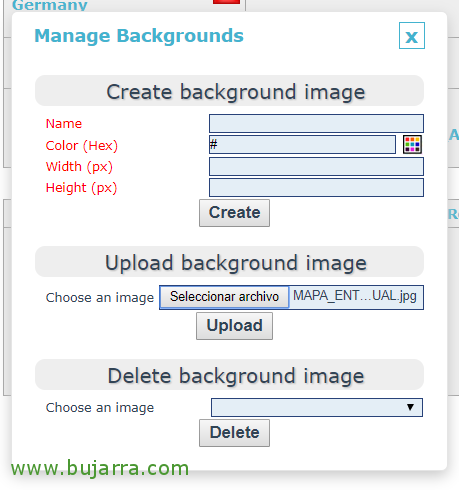
And from “Upload background image” select our JPG image and click on “Upload” to upload it.

Now we can create our first map, for this, We're going to “Options” > “Manage Maps”,

And about “Create Map”, We indicate a name to the map, as well as associating a format and size to the icons that we will put & finally we will select the background image that we have just uploaded to NagVis in the previous step, Pressed “Create” To create the map!
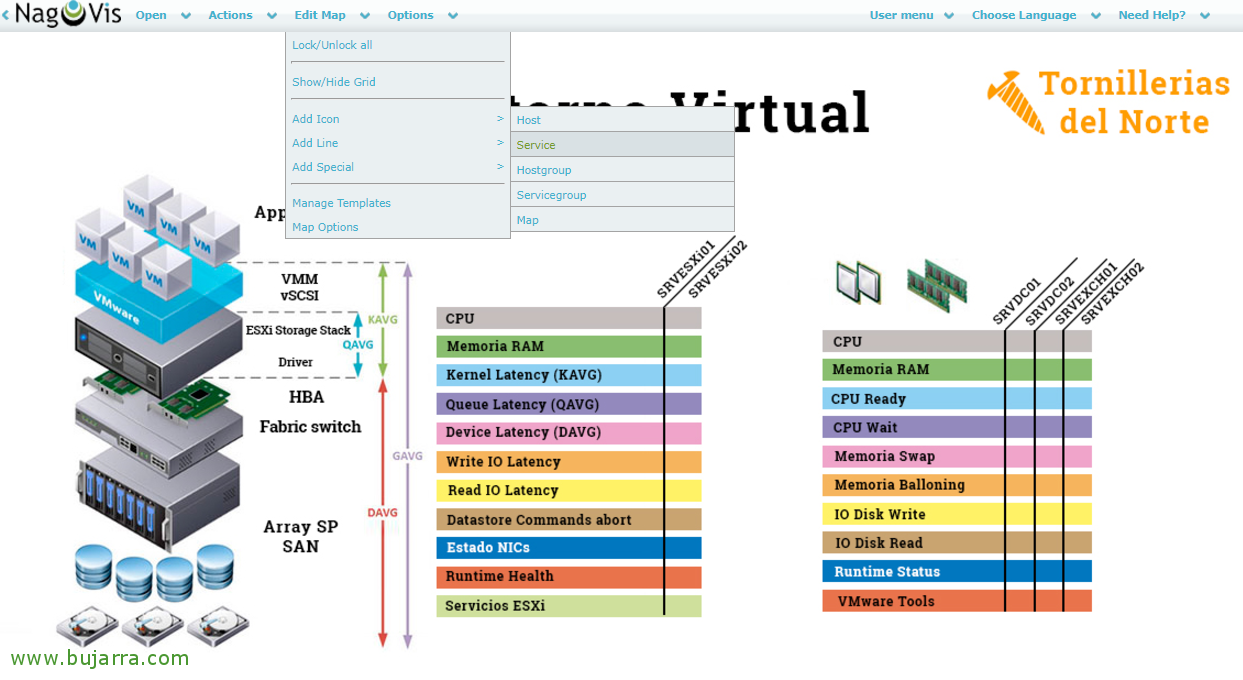
And we can start adding Objects to animate it! Let's start with something very simple, Let's put Services icons, that is, to view the status of a Service monitored by our Nagios or Centreon, for this “Edit Map” > “Add Icon” > “Service”. The mouse cursor will change us and we will get a cross, We must click on the area of the drawing where we want to add it.

And a pop-up window will pop up of what we want to add, in this example, I'm adding the Monitored Service called Host CPU SRVDC01, therefore, We look for it in the combos and add it. As we can see, We have tons of customization options, both at the individual level and generic at the map level. We will also use the X and Y coordinates to correctly align all the Objects that we add so that everything is well aligned. “Save”,

And we'll have our first item added! We see that the map is in Edit Mode, so we can continue adding or modifying objects calmly, The fastest to follow and create similar objects, will be to clone them and place them where we want them again, after that we will modify it and indicate to which other Service this new object corresponds.
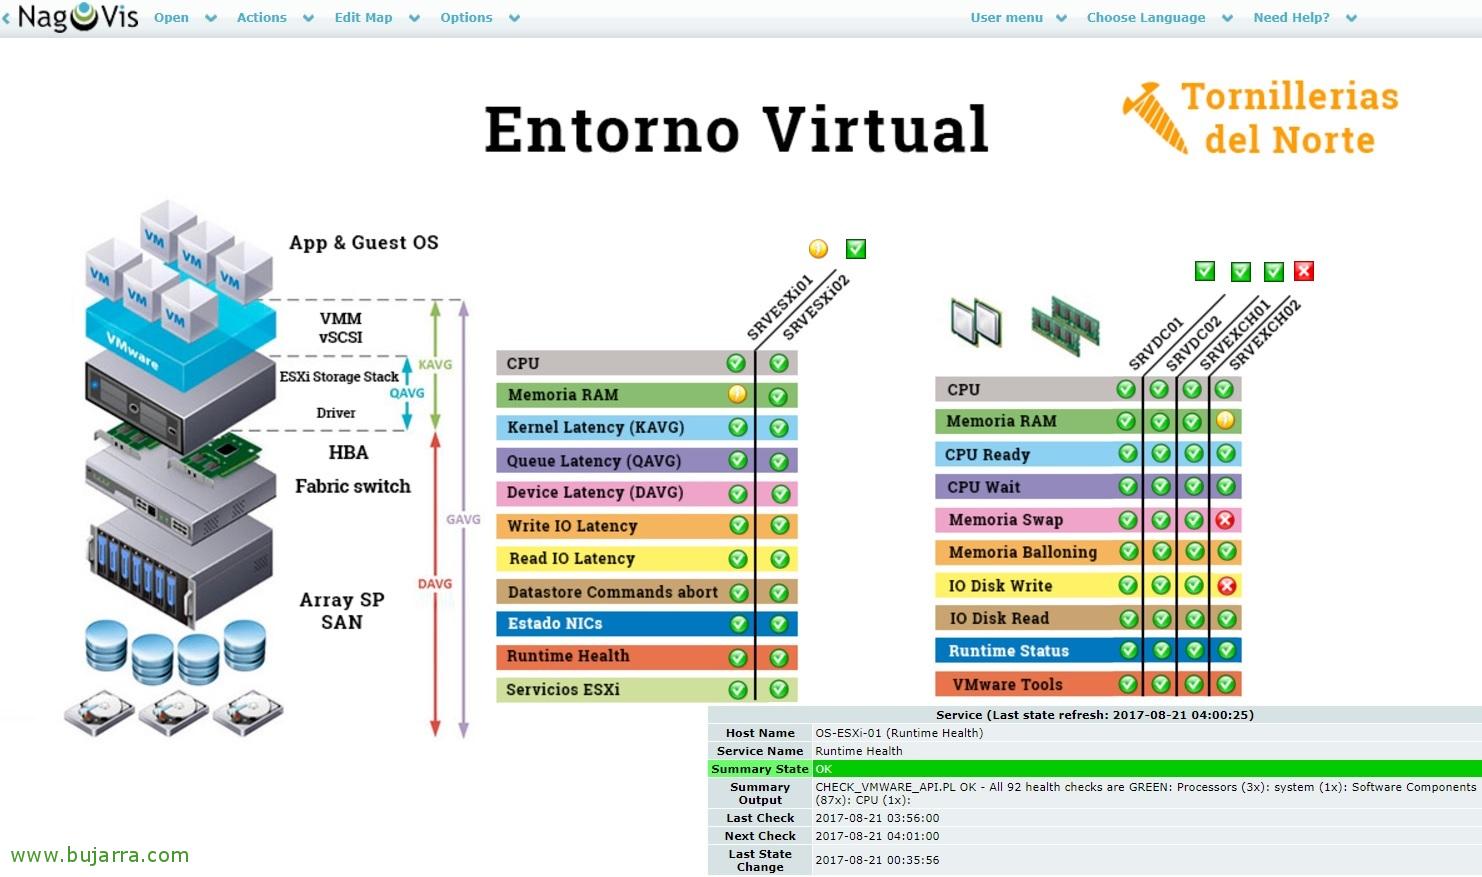
After a little work we will have our first map ready! in this case we see that I have added 2 ESXi hosts and 4 Monitoring Virtual Machines, where we will see at a glance its condition, performance if it could be affected we could orient ourselves with drawings like these. And then when we hover over each added Object we will see the status of the summary of that item.
Nice, No? Imagine with time and imagination the maps we can make of our organization!

More, What more objects can we add? Apart from adding Icons of status as we have seen that it will paint us green when it is OK, yellow when Warning and red with Critical. We can add icons of the Services status as we have seen, other than the status of a Host, or a HostGroup, also by Service Group or directly on the status of a Map. Well, we can also add lines, of the same types, Instead of being a circular icon it will be a line that we will paint. Apart from this, we can also add Forms, Text Boxes or Containers among other types of objects.
It is common to add shapes with navigation icons for our users, for those accessing NagVis. Let's think that our managers or whoever we want to give access to NagVis, we will give you access to a URL and we want to make it easy for you to navigate between maps, perhaps putting an icon of a little house so that they can go to the 'Home’ from our maps or wherever we want, Of course. We upload the images to be used in '/usr/share/nagvis/share/userfiles/images/shapes/’ and when we add a Shape object we will select the image to use from the combo, as well as indicate the URL to which it will go when you click on the.
Nothing, and to comment, The map and definition file will be created in '/var/lib/nagvis/'.
Network maps,
Another of the most interesting objects that we can add are living arrows, on network maps, They will be very useful to us as they will give life to the connections between switch mouths, Aps, WAN Mouths… and can be used to analyze bottlenecks at a glance. Therefore, in a static image that we upload with the drawings that interest us, we will interconnect their mouths with arrow-type lines and they will change color depending on the % of using that Network Interface (I'm telling you, be it from a router, firewall, switch, AP, server, camera, Windows, Linux, printer…), so think of a drawing where you want to visualize WAN traffics, LAN or SAN at a glance!!!
To do this you need to have the script 'check_iftraffic3.pl’ running in our Nagios or Centreon, We're going to: https://exchange.nagios.org/directory/Plugins/Network-Connections%2C-Stats-and-Bandwidth/check_iftraffic3/details (or better still with the 64-bit version). We'd do as usual, download the Script and place it in the Plugins path of our Nagios, create the Command in Centreon and the Services we need, one for each NIC we want to measure from each network device. This would be the format with which we should execute it:
[SourceCode]./check_iftraffic3.pl -H DIRECCION_IP -C COMUNIDAD_SNMP -L
./check_iftraffic3.pl -H DIRECCION_IP -C COMUNIDAD_SNMP -i 4 -u m -I 1000 -Or 1000[/SourceCode]
Where the first command will list the network adapters that machine has, and the second command monitors the indicated interface followed by the input and output bandwidth in Mbps. When we created the Command in Centreon, we would look something like this:
[SourceCode]$USER1$/check_iftraffic3.pl -H $HOSTADDRESS$ -C $_HOSTSNMPCOMMUNITY$ -i $ARG 1$ -B -u m -I $ARG 2$ -O $ARG 3$[/SourceCode]
Where the arguments will be:
[SourceCode]ARG1 : Interface
ARG2 : Max Input Bandwidth in Mb
ARG3 : Max Bandwidth Output in Mb[/SourceCode]

Well, if we follow the usual steps (after creating the Services that will monitor the NICs that we are interested in and exporting the config), from NagVis by uploading a static image that connects switches, for example, we create a map that will help us see the traffic between their mouths. We add the line object, On the background image we will click where we want to place the line, First click on the destination of the interface and second click on the source (so that it paints the outgoing/incoming traffic well and not the other way around and we draw the traffic in reverse). In the type of line we will see that in addition to painting an arrow, we will see that he can show us the % usage in addition to your current bandwidth!

And even though the screenshot I give you is somewhat chaotic, is to give you an idea of what things we can do, imagine one that measures all the paths of your SAN, or a drawing that measures Internet connectivity flows…
NagVis Gadgets,
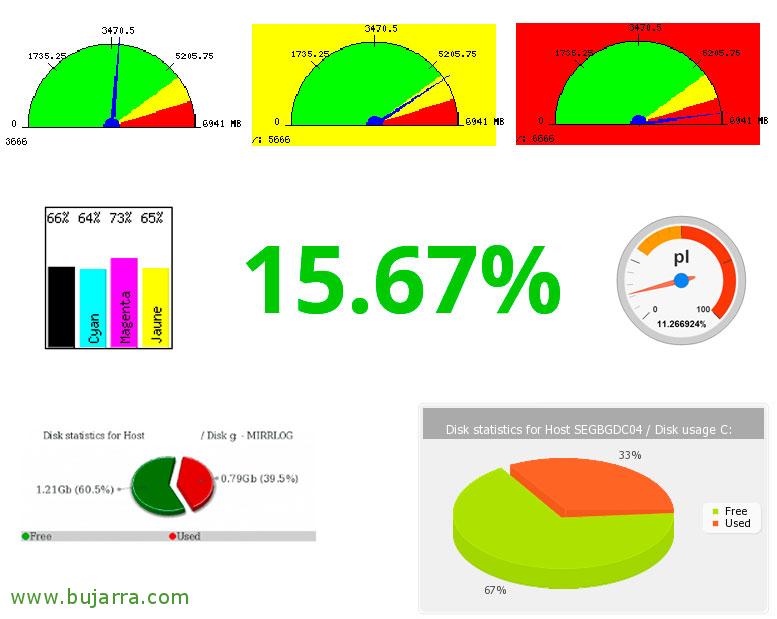
Apart from this, you should know that more objects can be added to the maps, like these that I show you in the image, be cheeses with % of use, Color Bars, Texts with the current value… These are the so-called Gadgets and we can download them from here: https://exchange.nagvis.org/exchange/Gadgets/
Rotation pool,
After having several maps in our environment, It will be interesting to make a pool or group of maps and that they go from one to another every certain period of time, or if an alarm goes off in any of them, it becomes the active map and a small alarm sounds. This, as you may be thinking, is ideal to put on a TV and pass live images with the maps that we want to viualize. If we edit the configuration file '/usr/lib/nagvis/etc/nagvis.ini.php’ or '/etc/nagvis/nagvis.ini.php’ It will depend on our distro… In the rotation section we can add as many as we are interested, In this example I would put 2, one for when managers access the Business Service maps and another rotation pool for my Department. and the TV we have hanging:
[SourceCode][rotation_MAPAS_TECNICOS]
maps="MAPA_ENTORNO_VIRTUAL,MAPA_DIRECTORIO_ACTIVO,MAPA_ENTORNO_CITRIX,MAPA_WAN,MAPA_LAN"
Range=10
[rotation_MAPAS_JEFES]
maps="MAPA_SERVICIO_NEGOCIO,MAPA_SERVICIO_ATENCION_AL_CLIENTE,MAPA_SERVICIO_VENTA_ONLINE,MAPA_SERVICIO_PRODUCCION"
Range=10[/SourceCode]
As you can see, it is easy to configure the Rotation Pool, We define its name, followed by the maps it will contain and the frequency range to move on to the next map. Once we save the file, in NagVis we will already have these Pools defined, so we can copy its URL and put it in the Browser we want it to access! Easy and simple, No?
How elegant and serious our monitoring platform looks, How proud to know the state of our platform at a glance and understand the architecture we draw, whatever role it may be, NagVis is a fundamental tool! I hope you enjoy it!