Centreon – First ride and some basic settings

Continuing with the monitoring posts with Nagios, We will continue with this second document, where we will first take a brief walk through some parts of the console to know what juice we can get. And then we'll enable some basic settings to start booting, which will be nothing more than importing some templates to easily start monitoring!
Another day, we'll look at some tools that link perfectly with Nagios, to control it remotely from other PCs or mobile devices, or the possibility of bringing this to life with personalized drawings or maps that we will monitor, etc, etc…
Paseito,

With nougat!!! After having already installed Centreon, we can log in to Centreon, We'll see that we have several tabs:
- Home: We will be able to add widgets and make a somewhat cool initial view with the most typical graphs that we usually consult. As well as seeing the poller statistics.
- Monitoring: It will be the part from where we will see the results of the monitoring, The services we discuss, this will be where we will see if the status is OK, WARNING or CRITICAL.
- Reporting: A cool section to measure SLAs and response times at the individual level or at the level of service groups or hosts.
- Configuration: Where we will configure the hosts to monitor, as well as their services or commands. In addition, In this section we can create or modify users, Notification Types, Pollers, Traps SNMP,
- Administration: To configure Centreon parameters, extensions whether widgets or modules, ACL Permissions, Logs, and monitor server status among others.
- Top Bar: Interesting, At a glance we will be able to monitor the general status of how many hosts or services are down.

To see a little bit what we're going to get, We focus on the tabs of “Monitoring” & “Reporting” since the rest, let's say they would be for configuration / Centreon administration. By clicking on “Monitoring”, We will see that we will be able to monitor the status of the monitored items or services in real time, as well as the status of the hosts (Servers / Printers / Routers / Switches / Fw…). We can also then group the services or servers by Type, in case we want to work on them together, This is, See for example all routers at a glance, or all web services…
We will see that the interface is very simple, that allows us to filter at all times by host, service, per group… From here we can also disable a service that is not temporarily monitored, or force it to be checked, enable the maintenance mode, for example, if we want to stop that service or host and it does not stain our graphics or alert us with CRITICALs when it is a scheduled shutdown; then this will come out in the charts and SLAs 🙂

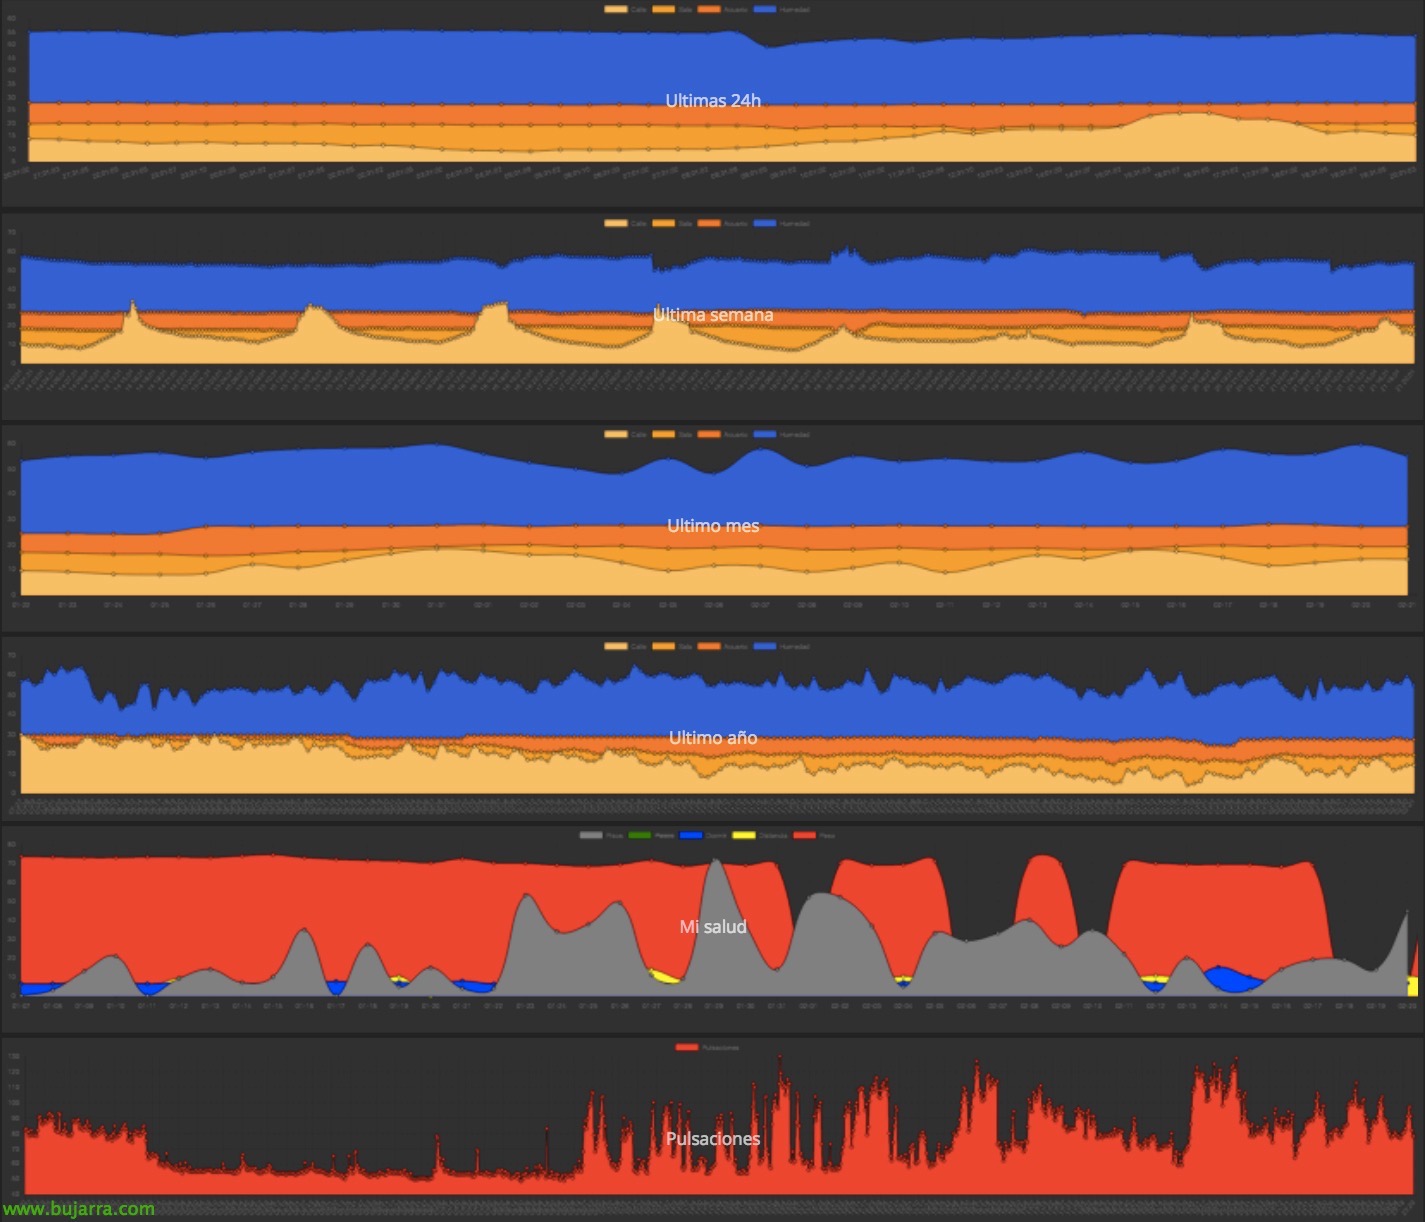
On the “Monitoring” > “Performances” we will see the graphs of what we are monitoring, It will paint the consumption of what we select and in the period we select, we can make brief comparisons, export the images or data that we see in CSV and then process them if interested in a very fast way.

For example, in the part of “Monitoring” > “Event Logs” we will be able to see a history of what has happened in our environment, which services or hosts have gone down and when, also seeing if when changing status it has notified, has performed retry, etc… As usual, we can also filter by date periods and export it in CSV or XML.

Finishing the main thing that Centreon is going to show us, in “Reporting” > “Dashboard”, we will be able to see and measure in a very graphic way the service times or SLAs that a host is giving well, a service or host group or service group. We see the % of time each item has been, the time in OK will be that it was running perfectly, WARNING will indicate that it exceeds the scale indicated but functional, CRITICAL will be the total downtime and also interesting, Know the scheduled downtime for maintenance!
We will be able to travel back in time with the lower bar to see the moment that interests us. When you click on any service or host, or when filtering by dates, The interactive graphic will be refreshed with the information we seek to know, will give us all details of its condition!
Add base templates,

Well, Hands on the dough, First of all,, since this facility is empty, I mean that it does not come with at least a basic monitoring pack, The most common thing is usually to download and install a base. We will go to “Administration” > “Extensions” > “Modules”.
And we'll install 'Centreon Plugin Pack Manager’ from the 'Actions' button.
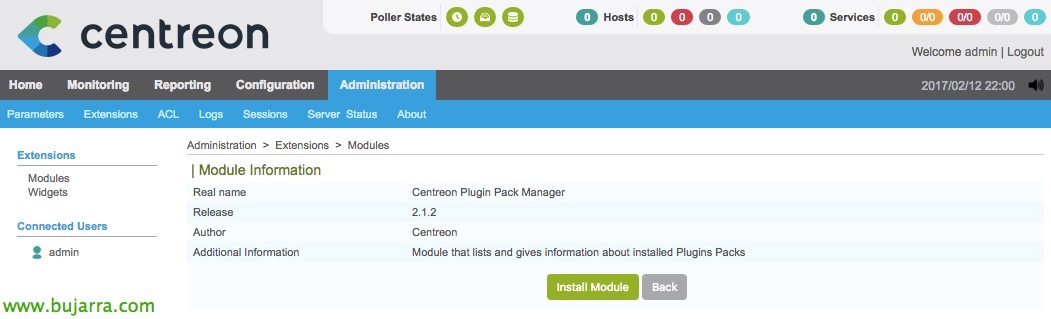
Click on “Install Module”,

Once installed, click on “Back”,

And now we will install 'Centreon License Manager',

“Install Module”,

After installing it, click on “Back”,

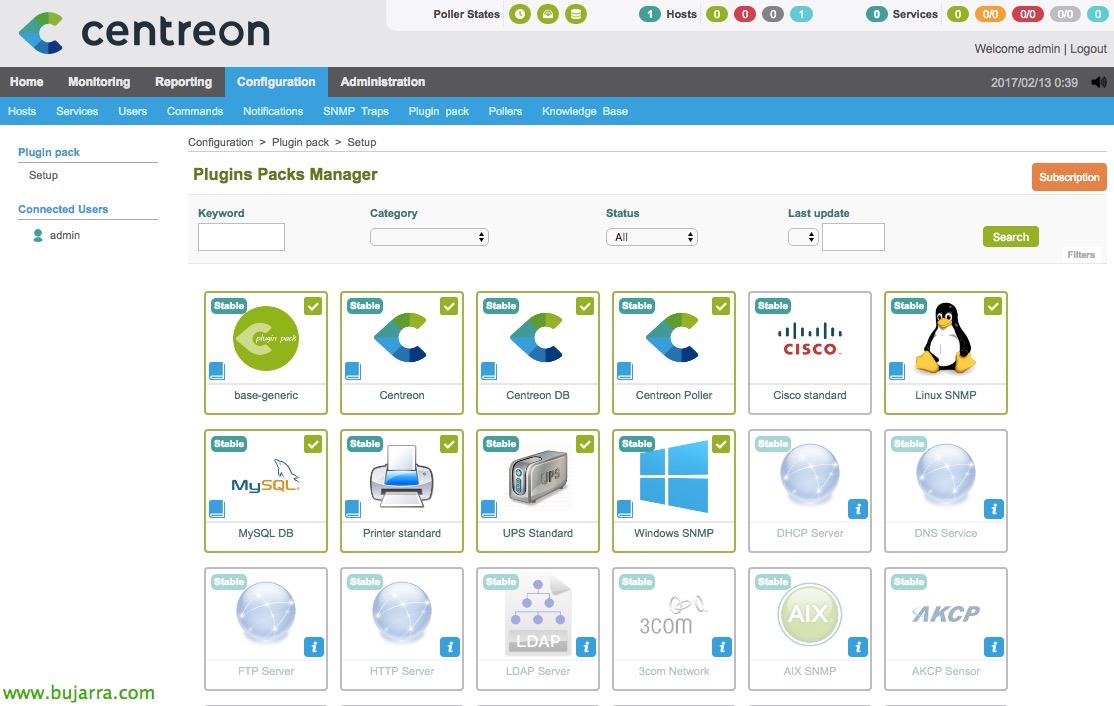
And now, yes, we're going to “Configuration” > “Plugin Pack”, we will arrive plugin manager that we will have to install. These will create the templates that we will need to create our hosts to monitor (hosts will be the servers, Printers, Devices…). So it will be good to have the base of all these and thus be able to monitor at least Linux computers, Windows, Printers, Cisco Devices, MySQL DB, as well as Centreon's own server, your database or the status of the poller.
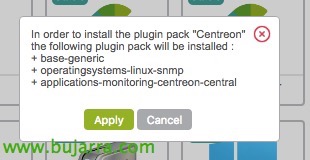
About each of them, We install & “Apply”,

Once the ones we are interested in have been installed, we can continue,
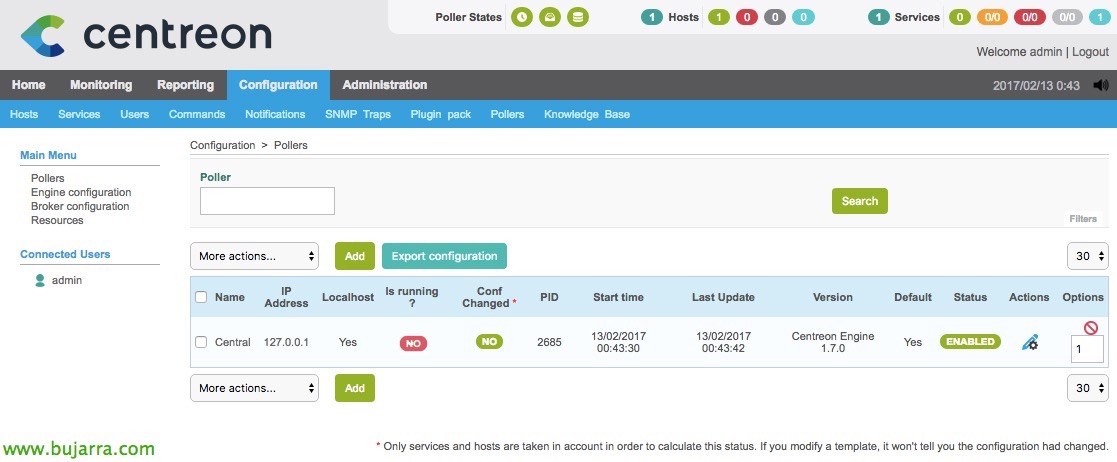
So the first thing to do is to save the changes generated, and then we can create teams with the templates we have just installed. To do this,, “Configuration” > “Pollers” > “Export configuration”.
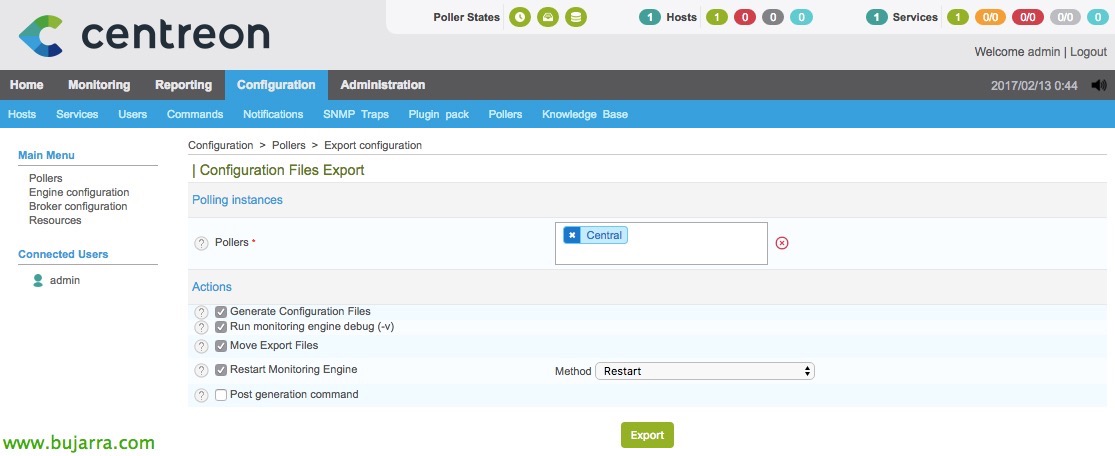
We add in 'Pollers’ the poller where we will apply the changes, by default we will have only this, 'Central'. We check the 'Generate Configuration Files' checks, 'Run monitoring engine debug (-v)’, 'Move Export Files’ and 'Restart Monitoring Engine', in 'Method’ select 'Restart'. And with this the Centreon interface will work magic and without having to touch Nagios files it will apply the changes we have just made, And we can start!