Measuring our electricity consumption with a Raspberry Pi

Continuing with documents of curious things we can do with a Raspberry Pi, Something very simple to achieve is for example to measure the electricity consumption of whatever we want, In this document we will see how to connect non-invasive current sensors to a Raspberry Pi and measure the cost of our home, since we will connect it to the electrical panel of our house! We will export the metrics to a MySQL database and then with Grafana we will create a dashboard where we can see in a very intuitive way what we spend on and how much!
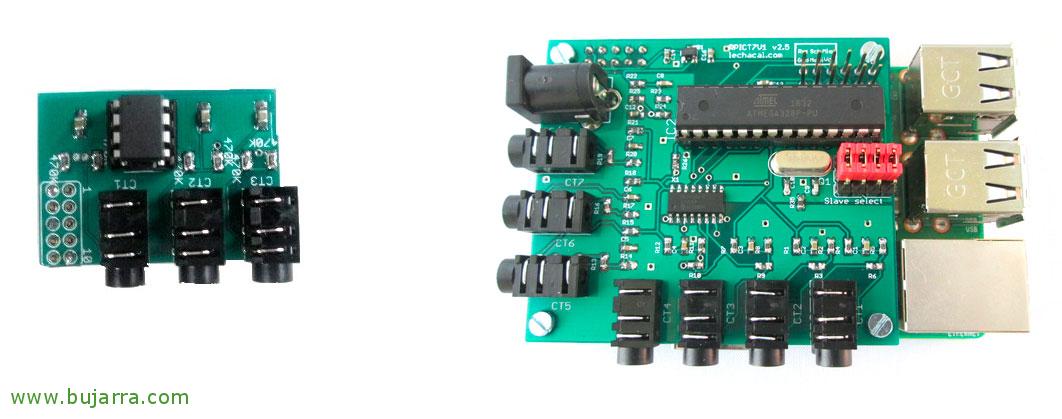
GOOD, What do we need to continue monitoring or giving a touch of home automation to our Home? Personally, the cheapest thing I found and that is interesting, is to put a little HAT on the Raspberry, I recommend you from the manufacturer Jackal since it has different HATs that will meet whatever our needs are, since we can connect them from 1 Non-intrusive sensor up to 8, it depends on the HAT we want, Of course, the more sensors you accept, the more expensive, but I think the price is more than affordable, go… And if we want to put more non-intrusive sensors, then we mount as many HATs as we need, one on top of the other! So:
I recommend you review this list of sensors so that each one can take the one that interests them the most: http://lechacal.com/wiki/index.php/Main_Page
The cheapest, for 3 sensors, some 12 Pounds: http://lechacal.com/wiki/index.php/RPICT7V1_v2.0. Remember when buying it that the output be in CSV format, You'll see when you buy it, but keep it in mind!
Then it would be necessary to acquire as many non-intrusive sensors as we need: SCT-013-000. We have them on the same website or on Amazon or eBay for about €4 each.
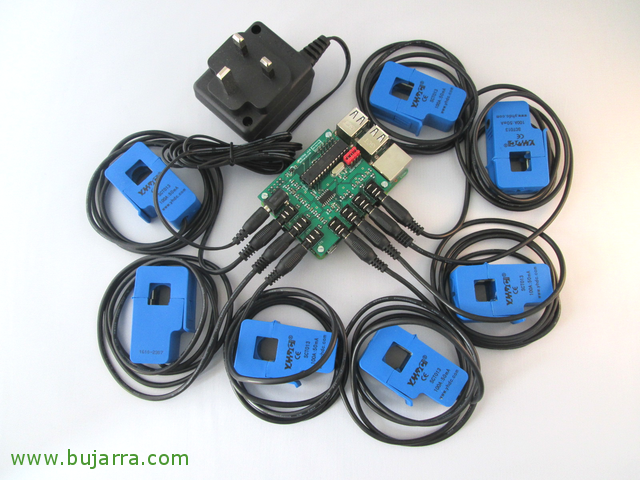
We will then connect the HAT to the Raspberry Pi and the sensors we have; In the clamps of the sensors we will take into account to pass only one cable, eh! And nothing, with that we will be able to know the consumption in Watts (W) What does each thing do?’ that we have pinched. We can measure from any electrical appliance, as well as what has been said, put this on the electrical panel of the house and measure the consumption from there, if we have it well labelled, it will not be difficult for us to measure the General consumption or that of the Lighting, Consumption of the plugs, of the fridge, oven, washing machine, Aquarius… What do I know!

With this command we will be able to connect by series to the HAT And see what he spits out. You will see that depending on the HAT you have purchased you will be able to see the current, voltage or temperature, which is what this command will spit out to you separated into commas.
[SourceCode]stty -F /dev/ttyAMA0 raw speed 38400
cat /dev/ttyAMA0[/SourceCode]
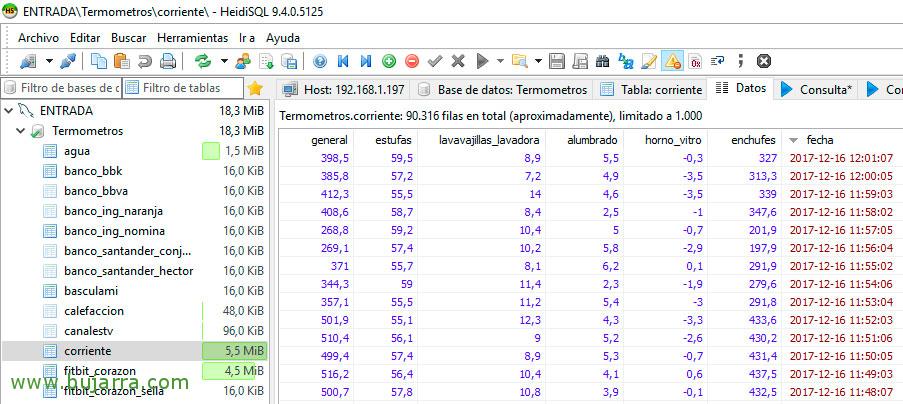
Now, What we will do is Treat those outputs (in CSV format), In my example if you look at it returns the watts of 7 Non-intrusive sensors, Each one of them I have connected to a cable in my electrical panel, When you see the code you will see what currents I measure (General, Stove plugs, Dishwasher and Washing Machine, Lighting, the Oven and the Ceramic Hob, and plugs. Then I export that info to a table that I have previously created in MySQL, So we will need to have MySQL installed on some machine (or install it on the Pi itself) and we will create the DB and the Table we want there, I give you my example that has a column for each sensor:
[SourceCode]CREATE TABLE 'Run-of-the-Mill' (
'general' FLOAT NULL DEFAULT NULL,
'stoves' FLOAT NULL DEFAULT NULL,
'lavavajillas_lavadora' FLOAT NULL DEFAULT NULL,
'lighting' FLOAT NULL DEFAULT NULL,
'horno_vitro' FLOAT NULL DEFAULT NULL,
'plugs' FLOAT NULL DEFAULT NULL,
'date' TIMESTAMP NOT NULL DEFAULT CURRENT_TIMESTAMP ON UPDATE CURRENT_TIMESTAMP
)
COLLATE='latin1_swedish_ci’
ENGINE=InnoDB
;[/SourceCode]
And nothing, Now we only have to have this wonderful script in python that will fill the Table 'Stream’ of our Database! We created such a script:
corriente.py
[SourceCode]#!/usr/bin/python
import serial
Import urllib
Import JSON
import MySQLdb
ser = serial. Serial('/dev/ttyAMA0', 38400)
response = ser.readline()
z = response.split(",")
If Len(z)>=7:
print "General: %s Watts" % z[0]
print "Estufas: %s Watts" % z[1]
print "Lavavajillas y Lavadora: %s Watts" % z[2]
print "Alumbrado: %s Watts" % z[3]
print "Horno y vitro: %s Watts" % z[4]
print "Enchufes: %s Watts" % z[5]
general_valor=z[0]
estufas_valor=z[1]
lavavajillas_lavadora_valor=z[2]
alumbrado_valor=z[3]
horno_vitro_valor=z[4]
enchufes_valor=z[5]
db = MySQLdb.connect("localhost","root","xxxxxx","NOMBRE_BASE_DATOS")
cursor = db.cursor()
cursor.execute("""INSERT INTO corriente (general,Stoves,lavavajillas_lavadora,lighting,horno_vitro,Plugs) VALUES (%s,%s,%s,%s,%s,%s) """, (general_valor,estufas_valor,lavavajillas_lavadora_valor,alumbrado_valor,horno_vitro_valor,enchufes_valor))
db.commit()[/SourceCode]
And that's it! What remains is to schedule this script to run with the interval we are interested in, Run ‘crontab -e‘ and we add the following so that it runs for example every minute:
[SourceCode]* * * * * python /home/pi/corriente.py[/SourceCode]
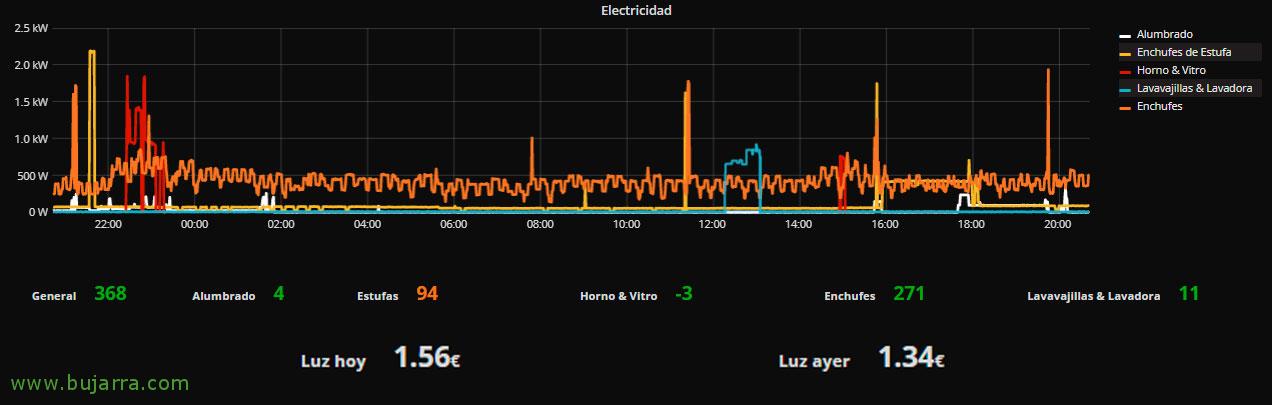
What would it be the Ginda to finish? Well, the usual, thanks to Grafana, We will be able to work on any data in a super simple and fast way, as in this example a MySQL table. If you don't have Grafana mounted, review This document, and after that, you can create a Dashboard where you will add whatever you want. Here are some examples:
Graph where we add the metric and I painted it for us, in this case the Consumption of the plugs:
[SourceCode]SELECT enchufes as value, "Enchufes" as metric, UNIX_TIMESTAMP(date) as time_sec FROM corriente WHERE $__timeFilter(date) Order by time_sec ASC[/SourceCode]
Graph where we add the metric of the Lighting consumption:
[SourceCode]SELECT alumbrado as value, "Alumbrado" as metric, UNIX_TIMESTAMP(date) as time_sec FROM corriente WHERE $__timeFilter(date) Order by time_sec ASC[/SourceCode]
With the Singlestat plugin we can show for example the current expenditure of the Generall:
[SourceCode]SELECT general FROM current order by date desc limit 1[/SourceCode]
I hope you have found it useful, be free to modify and customize it as you need! As I'm telling you in other posts, I'm using these nonsense in one of those magical mirrors or MagicMirror, where I get handsome in the morning and I have some info, One day I'll tell you all about it, But for now, Little by little! If you have come this far, thank you for reading me! and everyone you share on social media!