Monitoring thanks to snmpwalk

Continuing with documents on Nagios or Centreon, Let's go with a post that may be in common use, above all, when we need to monitor something by SNMP and the Internet gurus have not developed a script that we need. We will see then, how to query over SNMP what a device might 'spit out'’ Thanks to SNMPWALK and then we will monitor it! And at the end of the document we'll look at how to monitor the traffic of any network device that has SNMP enabled as well!
In this example, we'll use an HP Procurve switch, We'll look at how to get the metrics we're interested in, we will not only be able to see the status of the chassis or its sensors, but also measure network traffic or know the status of its mouths, all this with SNMP. Once we have enabled SNMP on the device, it's time to go to the machine with Nagios or Centreon and consult!!

With the snmpwalk utility we will be able to check what a device that has SNMP enabled responds, we will be able to obtain all the OIDs and process them. We try to see what we can get on this switch…
[SourceCode]snmpwalk -On -c COMUNIDAD_SNMP -v VERSION DIRECCION_IP[/SourceCode]
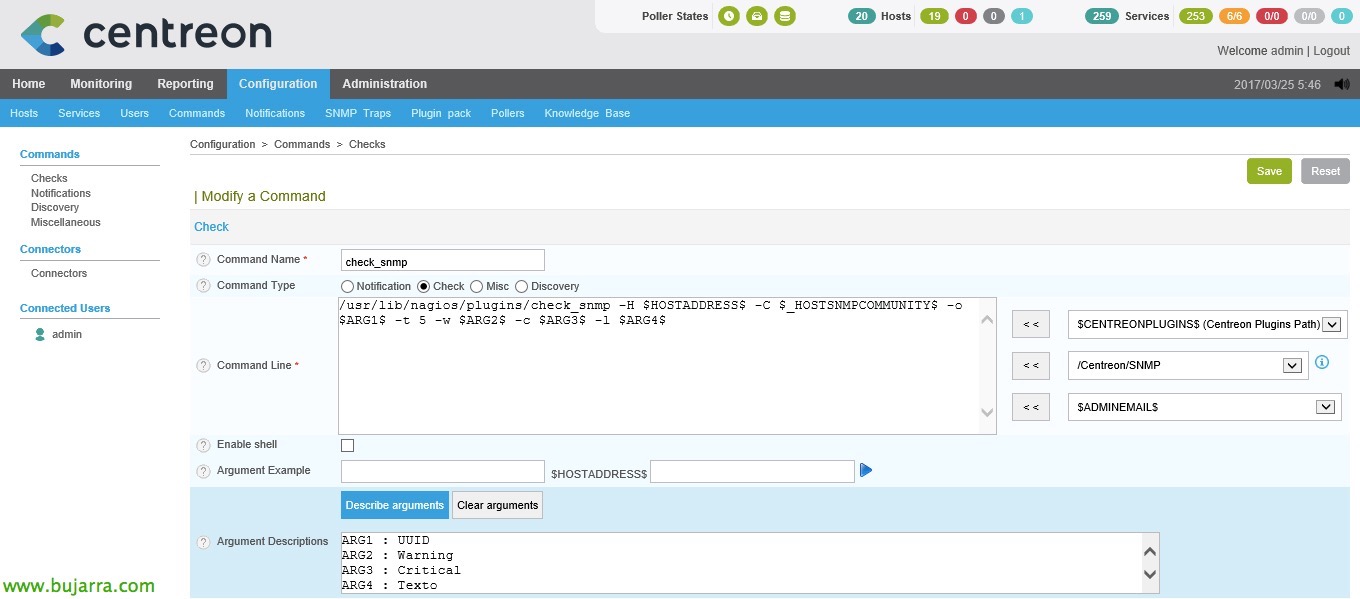
After locating the OIDs we are interested in, if we go to Centreon, we can monitor them thanks to the 'check_snmp' command, this Command is already predefined so we will not have to do anything more than create the Services directly! We can add it if we are interested in more parameters, for example -t for the timeout and raise it, or -u to define the value as bytes, %…

Let's go “Configuration” > “Services” and we added a new one, we associate it as always with the indicated Host, in this case my Switch, we optionally add a template, usually the generic, and we must select in “Check Command” The 'check_snmp’ and to complete the arguments that he asks us to. We must indicate the OID we want to consult, followed by the values that will alert such as Warning or Critical and the text that we will see additionally.
In the case of these switches, the Services I will create are as follows:
- Power Supplies using .1.3.6.1.4.1.11.2.14.11.1.2.6.1.4.2
- Free memory using .1.3.6.1.4.1.11.2.14.11.5.1.1.2.1.1.1.6.1
- CPU using .1.3.6.1.4.1.11.2.14.11.5.1.9.6.1.0
- Fans using .1.3.6.1.4.1.11.2.14.11.1.2.6.1.4.1
- Temperature Using .1.3.6.1.4.1.11.2.14.11.1.2.6.1.4.4
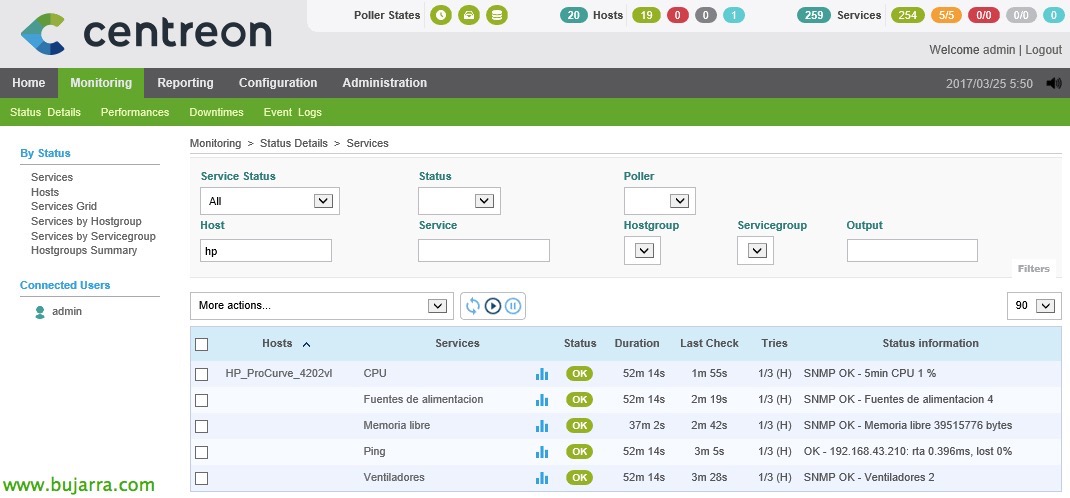
Well, and what I said, once we save the configuration we will see the status of the monitored Services!

To remember and link a little, with 'check_centreon_snmp_traffic’ we will be able to monitor any network mouth of any device by SNMP, be the interfaces of a router, Any Switch Mouth, that of a Windows, Linux, whatever, for this, Run:
[SourceCode]./check_centreon_snmp_traffic -H DIRECCION_IP -C COMUNIDAD_SNMP -s[/SourceCode]
If we need to remember how to create the Services in Centreon, We can see it in This document, in the “Monitoring network traffic“. I hope it has been of interest to you! enjoy!