Nagios – Monitoring our Centreon server

Well, before continuing with more configuration posts about Centreon, We make a stop along the way, Let's go with something more entertaining, We will see a small example of what we will be able to monitor. And what less than to start monitoring our own Centreon appliance and thus start to see some possibilities and get ideas!
In this document, We'll look at how to create a host to monitor, what will be the Centreon machine, and to which we will associate some base templates that we have already imported into a Previous document via the Centreon Plugin Pack. Later we will also see how to enable and configure SNMP on the Centreon machine so that it can query itself. With this we will have everything under control!
Adding the Centreon host to monitoring,
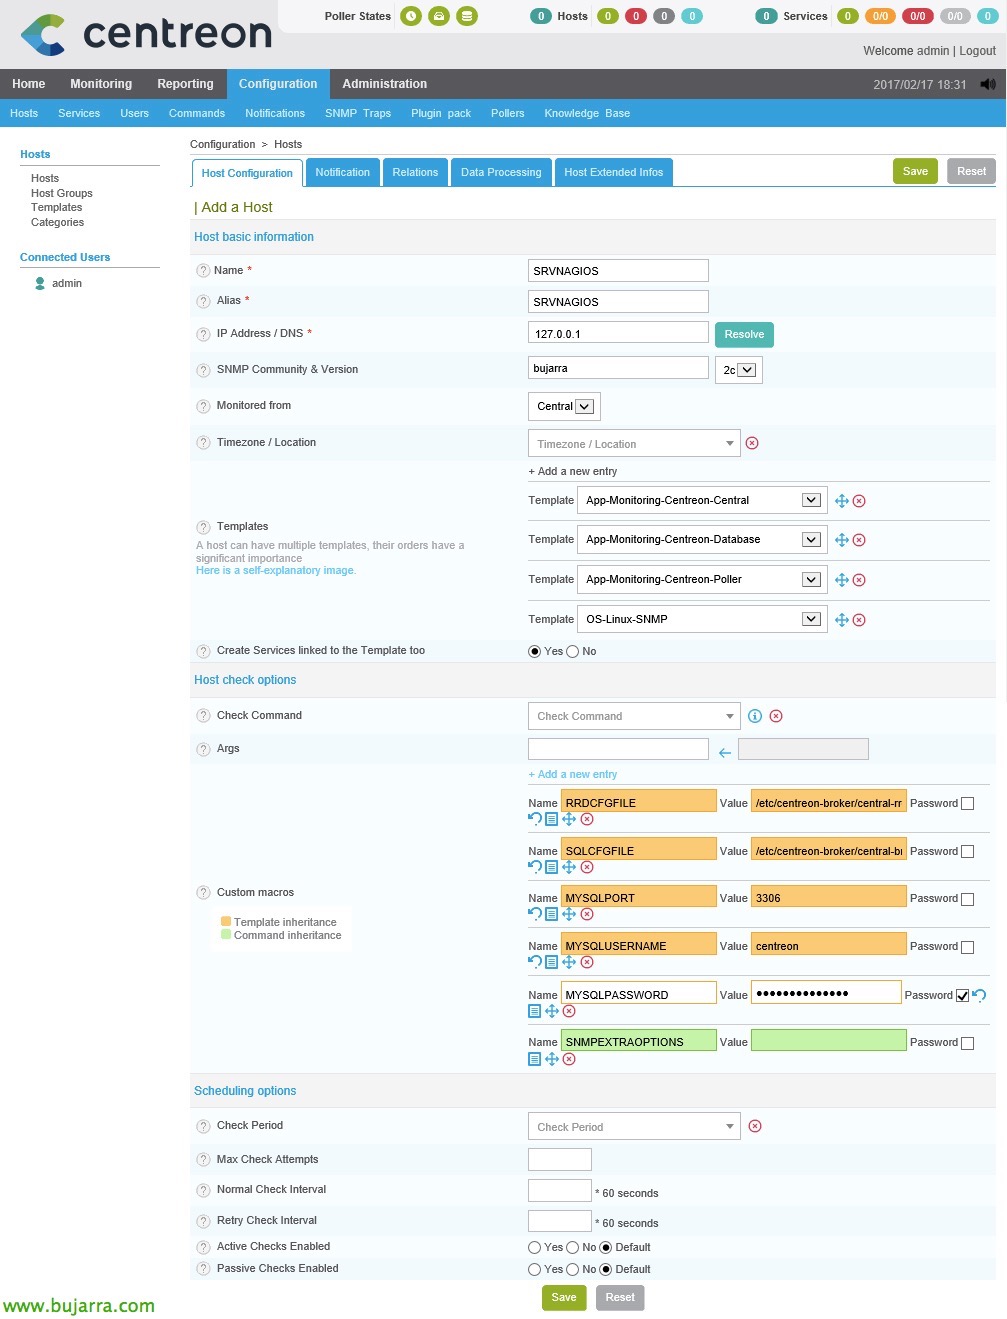
GOOD, We're going to “Configuration” > “Host” > “Add…” and we add a new machine to monitor, we will fill in at least the following fields:
- Name: It will be the name of the machine in Centreon.
- Alias: It will be the alias or how we will see the machine in the alerts.
- IP Address / DNS: We provide the local IP address, This is 127.0.0.1
- SNMP Community & Version: We indicate the SNMP community & 2c.
- Monitored from: Select 'Central'.
- Templates: Here comes the interesting thing about this document, than by associating this host with some pre-established templates that we installed before, We can add them and directly when this host is created, The necessary services will be created to monitor the selected. In this case, I add the 'App-Monitoring-Centreon-Central' templates, 'App-Monitoring-Centreon-Database', 'App-Monitoring-Centreon-Poller’ and 'Linux-SNMP OS'; That as we will see, will be used to monitor the availability of these roles.
- Create Services linked to the Template too: Yes.
- Agrs: These are the arguments that we must fill in so that the commands that are executed, Have the right information. These are inherited as we see from the templates we just marked, In the case that concerns us:
- RRDCFGFILE: /etc/centreon-broker/central-rrd.xml
- SQLCFGFILE: /etc/centreon-broker/central-broker.xml
- MYSQLPORT: 3306
- MYSQLUSERNAME: centreon
- MYSQLPASSWORD: The user's MySQL password centreon.
Certain options may not have to be configured since we inherited them from a base template, in this case I use only the preset templates that come with. In another document, We'll look at how to modify a base template so that the hosts we create from it have a common base configuration that they will all have, be it for example the name of the community, Check-up periods, Check-up times, notifications…
Well, with this we have already added the Centreon server that we are going to monitor, easy, No?
Configuring the SNMP community on the Centreon appliance,
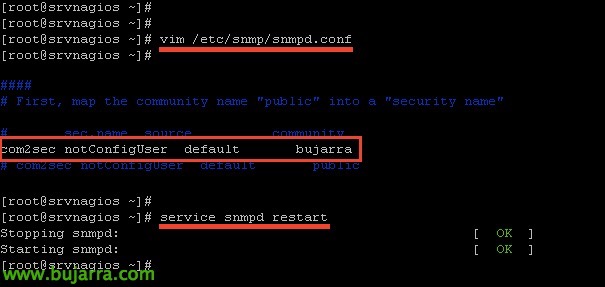
Before you go any further! We have to add the SNMP community to the linux machine, as in the Centreon appliance SNMP is already enabled, We will only have to modify the file '/etc/snmp/snmpd.conf’ Adding the Community:
[SourceCode]com2sec notConfigUser default COMUNIDAD_SNMP[/SourceCode]
And we restart the service!
[SourceCode]Service SNMPD Restart[/SourceCode]
Recording the settings,
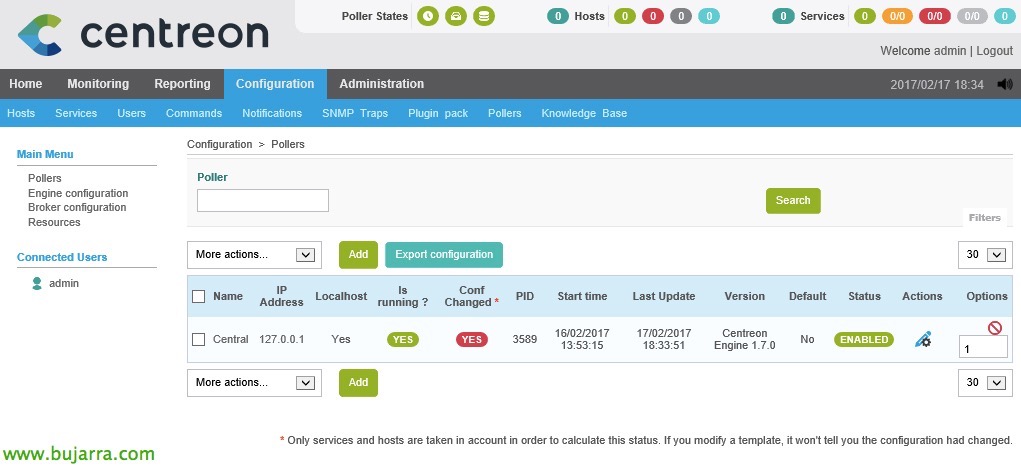
This process, will be the one we will use whenever we want to save the changes made in Centreon, Ok? When we make any changes to a host, service… or whatever, Once we want you to load such a configuration we will follow these steps. We're going to “Configuration” > “Pollers” > “Export configuration”,

Mark “Generate Configuration Files”, “Run monitoring engine debug”, “Move Export Files” and “Restart Monitoring Engine”, in the, Select “Restart” and click on “Export” to start generating the necessary files, We will see at the bottom the progress in case we have done something wrong, will tell us.
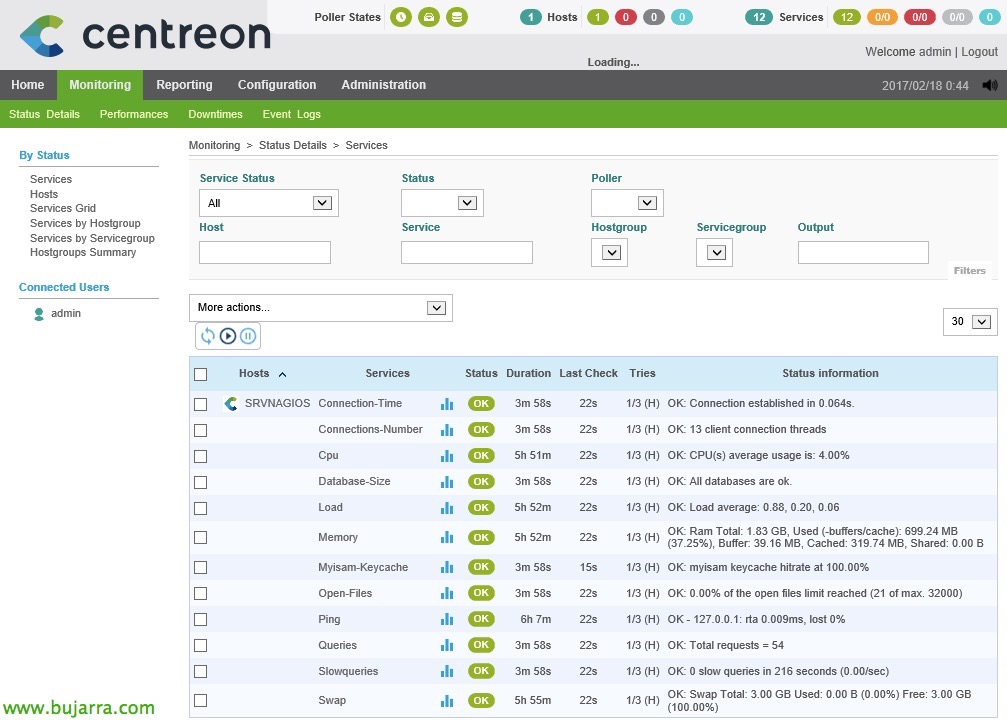
And that's it!!! All that remains is to verify it! We are going to “Monitoring” > “Status Details” > “Services”, and from there we will be able to see the host and the services we are monitoring! As is our first example, we will only have this machine with all the services that it has generated from the templates, so much are the CPU checks, Load, Memory, Size of Database, Queries, Sessions… if we do not want to wait for these items to be monitored, we can force a check of them by selecting them and in the combo of “More actions” Choose “Services – Schedule immediate check (Forced)”.
Well, Not bad to start with, No? We can start to gossip about the graphs a little, We can rename the services if we prefer, Change the chart type… We continue with more in other documents!!!