Getting data from the Fitbit bracelet using Python and displaying graphs in Grafana

How is it going? Today we are going with a document that will surely be of interest to all those who have a Fitbit bracelet, with which you already know that we can obtain data about our lifestyle and such… Well, if you want to exploit this information and see it in beautiful graphics, This is your document! Using a Python script we will obtain the measurements that interest us and store them in a MySQL database, and then with Grafana paint the graphics that interest us!
As I suppose there will be many fans around here of Raspberry Pi and other fricadas, Imagine that you have a MagicMirror mounted, You already know a mirror with monitors behind it and you want to automate your home by giving it another additional touch and when you see yourself in a mirror you know your progress, the kilometers traveled, Steps taken, calories burned, Pulsation graphs, Floors Climbed… Well… You can achieve everything by following these steps, One day I'll put interesting projects that I have set up at home 🙂
What I said, What we'll need? A server with Apache and MySQL installed, we will create a database where we will store what we are interested in (We'll look at a couple of examples), we will register on the Fitbit website to create an App and we will see how to obtain the Access Token that we will use in a python script to suck the information from the Fitbit cloud into a json file that we will save locally to later export it to the DB. After that he is already sucked, as I'm sure you already have Grafana installed (And if you don't take a look Here), what we will do is make MySQL queries to the DB to get what we are interested in seeing!
The scenario is very simple, a Raspberry Pi that every day at the 23:55h executes a python script that does the above, stores the data of each day in the tables of the MySQL database and will be accessed from wherever we have the Grafana installed, be on the same Raspberry Pi, on another machine… As always I tell you, I'm not a programmer or developer, I'll just show you how I got it in case anyone is interested in doing cool things! Sure there are other methods, But this one is not that complicated!
The first thing to do is to access the website of https://dev.fitbit.com and create an account if we don't have one, After that, We access https://dev.fitbit.com/apps/new and create a new app by following these steps:
- Application Name: We indicate a descriptive name, in my case Python Pi 197
- Description: We write something that associates this app with the project we are working on.
- Application Website: We put a URL, For example http://www.bujarra.com
- Organization: Organization Name, p. e.g: Bujarra
- Organization Website: We indicate the URL again, HTTP://www.bujarra.com
- OHuth 2.0 Application Type: We select 'Staff’
- Callback URL: We leave http://google.com
- Default Access Type: We confirm that it remains as 'Read Only'.
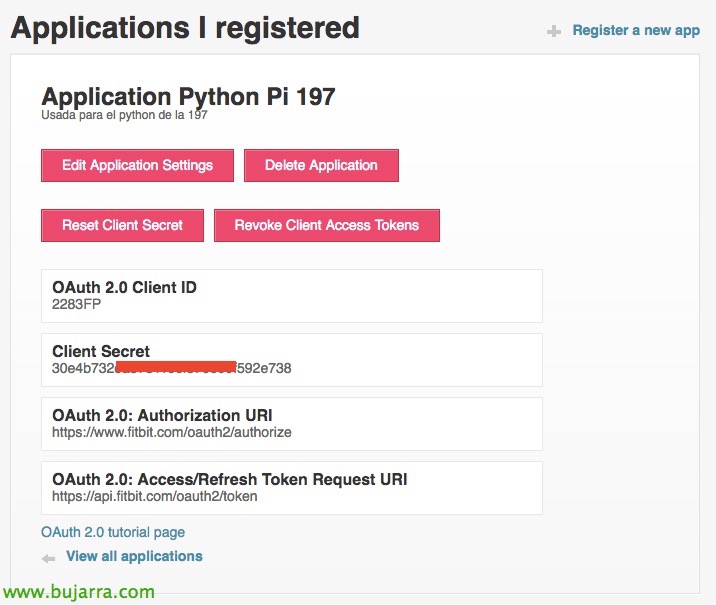
We record the app and on its properties we will be able to see which is our Client ID and our Client Secret that we will write down there since we are going to need it.
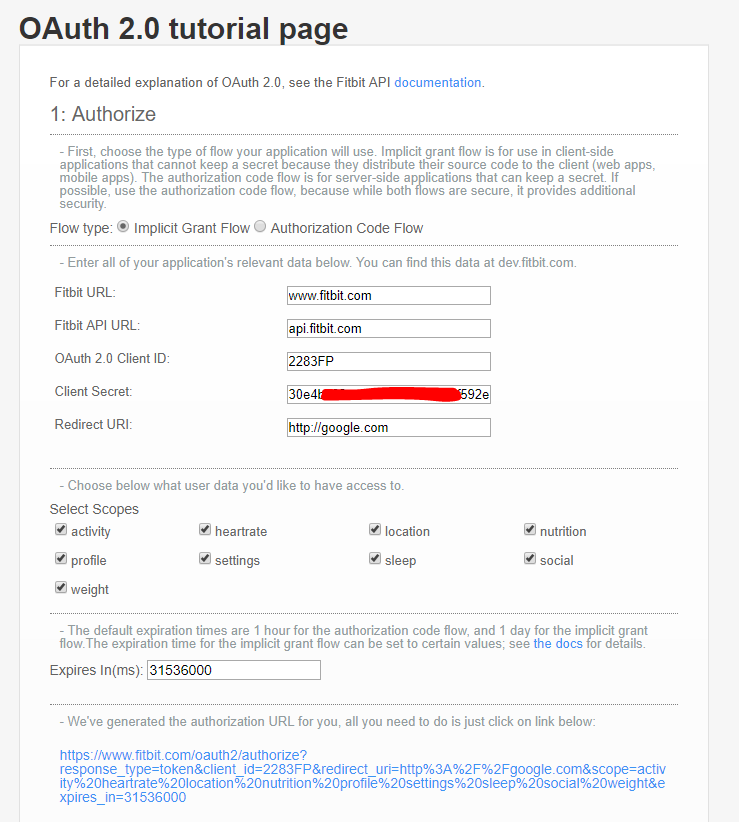
We access https://dev.fitbit.com/apps/oauthinteractivetutorial to generate the Access Token What will be what we need to validate ourselves when making queries from Python. So we fill in the data in the section 1, where we will indicate our Client ID, our Client Secret and we instruct you to redirect us to any website, We mark the information about our health that we want to give access to and important, We must indicate the expiration time for the Token (86400 for 1 day 604800 for 1 week 2592000 for 30 Days 31536000 for 1 year), the normal thing will be to put the value of 1 year so as not to have to renew the Token. Click on the link that it shows us and open it in a new tab, we copy the URL.
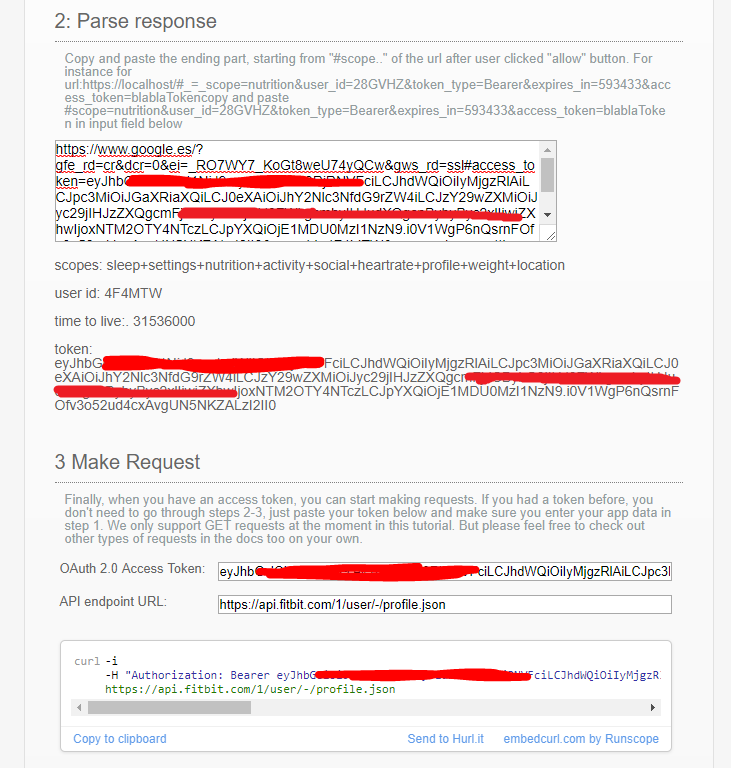
And in the Part 2 We paste the answer and verify that the data is correct, If so, we will finally have our Token!
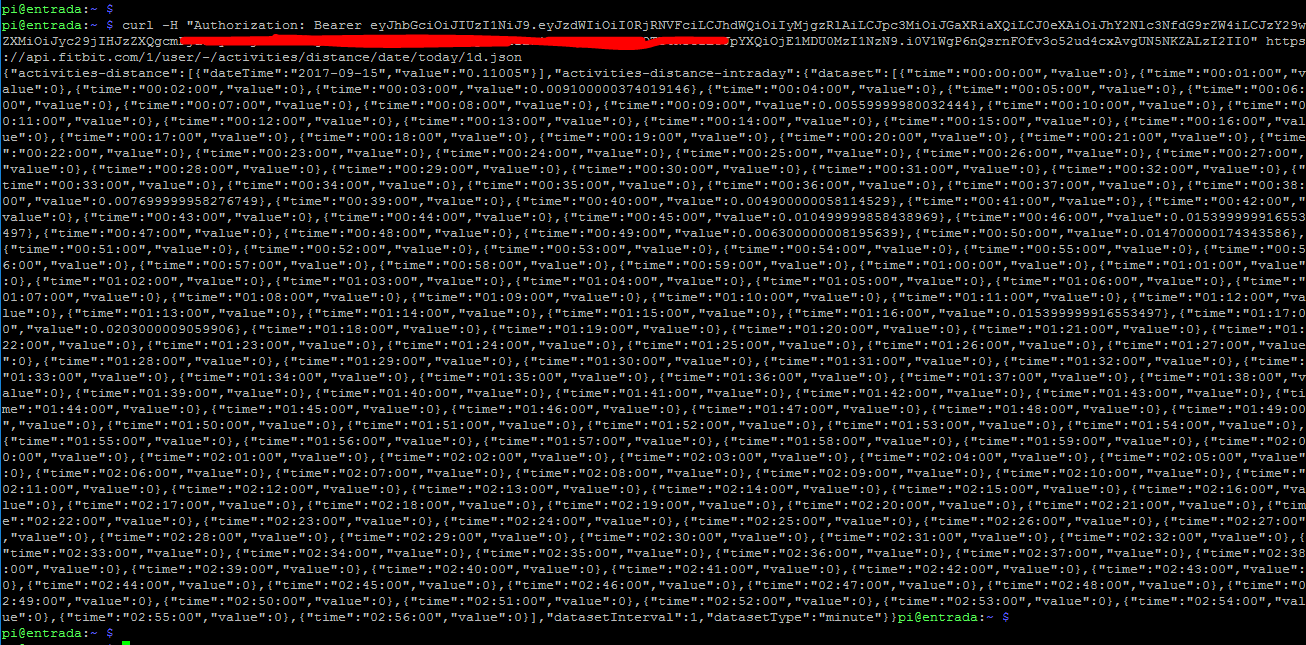
So if we want to validate that we can already access the data from our Raspberry we can execute the following command to visualize the data of the distance traveled on the last day every minute, If everything is correct, it will show it in JSON format. Run:
[SourceCode]curl -H "Authorization: Bearer NUESTRO_TOKEN" https://api.fitbit.com/1/user/-/activities/distance/date/today/1d.json[/SourceCode]
On this website you have more examples to see more information about other values or other periods: https://dev.fitbit.com/reference/web-api/activity/#get-daily-activity-summary.
And if everything is correct we can create a small script that I will call it 'fitbit_carga_datos.sh‘ which will get the last day of Fitbit data, both the distance traveled, The steps taken, The floors climbed, heartbeat or time asleep among other information. Each type of info I will save in a json file that I will leave in the Apache directory, since we will need it later. This would be the script that loads the data into the DB:
[SourceCode]# DISTANCE
curl -H "Authorization: Bearer eyJhbGxxxxxxLzI2II0" https://api.fitbit.com/1/user/-/activities/distance/date/today/1d.json > /var/www/temp/fitbit_distancia.json
/usr/bin/python /home/pi/fitbit_distancia.py
# STEPS
curl -H "Authorization: Bearer eyJhbGxxxxxxLzI2II0" https://api.fitbit.com/1/user/-/activities/steps/date/today/1d.json > /var/www/html/fitbit_pasos.json
/usr/bin/python /home/pi/fitbit_pasos.py
# FLOORS
curl -H "Authorization: Bearer eyJhbGxxxxxxLzI2II0" https://api.fitbit.com/1/user/-/activities/floors/date/today/1d.json > /var/www/html/fitbit_pisos.json
/usr/bin/python /home/pi/fitbit_pisos.py
# HEART
curl -H "Authorization: Bearer eyJhbGxxxxxxLzI2II0" https://api.fitbit.com/1/user/-/activities/heart/date/today/1d.json > /var/www/html/fitbit_corazon.json
/usr/bin/python /home/pi/fitbit_corazon.py
# SLEEP
FETXA=`date +"%Y-%m-%d"`
curl -H "Authorization: Bearer eyJhbGxxxxxxLzI2II0" https://api.fitbit.com/1/user/-/sleep/date/$FETXA.json > /var/www/html/fitbit_dormir.json
/usr/bin/python /home/pi/fitbit_dormir.py[/SourceCode]
As we can see, we will have to change and put our token well, After downloading the data from the website, it saves it in the JSON file as we said and then executes a file in Python that takes each JSON and inserts it into a different database.
We save it and make it executable!
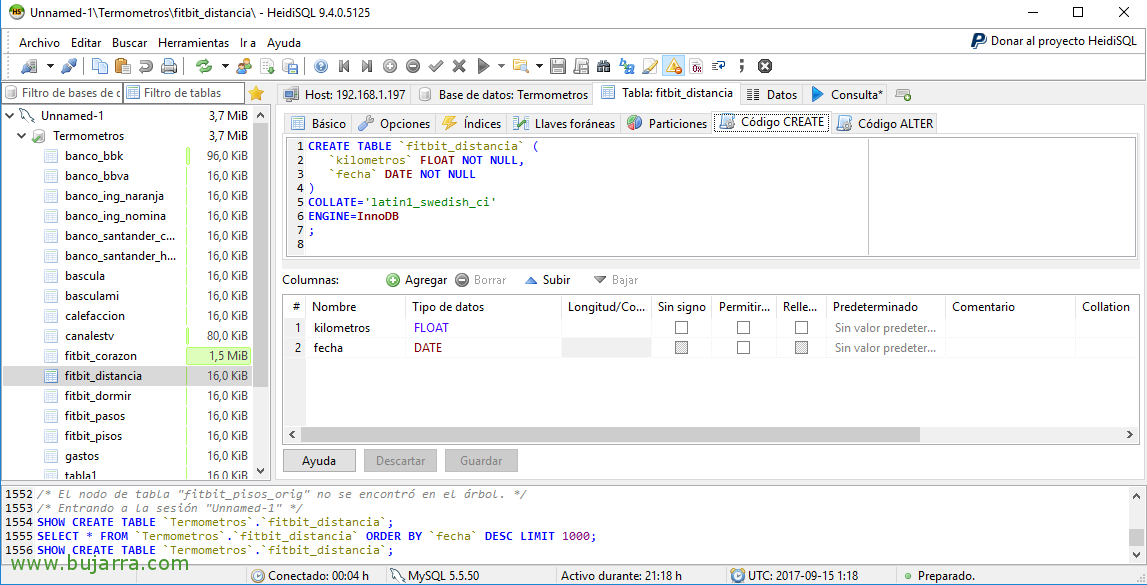
Therefore, We will have to create as many Python scripts as metrics we are going to analyze, but before we go any further, we are going to make a stop on the way and we are going to Create the databases and tables that we need, which will be where the python file will import each json into the corresponding TABLE. We can do it through a MySQL manager such as HeidiSQL or directly from the linux shell connected by shell. We create a TABLE for each measurement, in my case they are called the tables: fitbit_distancia, fitbit_pasos, fitbit_dormir… and they are very simple, Have 2 Columns, One called 'kilometers'’ (FLOAT) and another called 'date’ (DATE) in the case of distance DB; in the fitbit_pasos will be 2 Columns: Steps and Date, for fitbit_pisos: Floors and Date… and so on, Yes? We could create a single table with more columns as well, but we go each one as we want. Example for creating the table:
[SourceCode]CREATE TABLE 'fitbit_distancia' (
'kilometers' FLOAT NOT NULL,
'date' DATE NOT NULL
)
COLLATE='latin1_swedish_ci’
ENGINE=InnoDB
;[/SourceCode]
After defining where the data is stored, what we will do is create the python files that will read the JSON file with the data and then process its content by looking for the value that interests us and inserting it in the corresponding table, And I'm the way I got it, I imagine that what has been said there will be better ways.. I leave you an example of one of the Python files, in this case he will be in charge of reading the kilometers and entering them into the DB:
fitbit_distancia.py
[SourceCode]Import urllib
Import JSON
import MySQLdb
db = MySQLdb.connect("localhost","root","CONTRASEÑA","NOMBRE_BASE_DATOS")
cursor = db.cursor()
url = 'http://IP_RASPBERRY/fitbit_distancia.json’
urllib.urlopen(URL).read()
Response = urllib.urlopen(URL).read()
json_obj = json.loads(response)
for product in json_obj["activities-distance"]:
VALUE = product["value"]
DATE = product["dateTime"]
cursor.execute("""INSERT INTO fitbit_distancia (Km,date) VALUES (%s,%s) """,(VALUE,DATE))
db.commit()[/SourceCode]
So, The first 'fitbit_carga_datos.sh script’ the statistics of the Fitbit website will be downloaded in a JSON, and each Python script will read that JSON and put it in the corresponding table. For more comfort, or in case you have doubts, I leave you my scripts at this link, you will only have to put your Token and create the tables you need! And we program it to execute it every day at 23:59h, This is how you will get all the metrics of the day. En 'crontab -e’ we add:
[SourceCode]59 23 * * * /home/pi/fitbit_carga_datos.sh[/SourceCode]
Now the bad… Not bad, What does this do? Get only today's, No? And what happens if we haven't synchronized? or if the last time was 4h ago? Well, yes, we would lose the unsynchronized data, So a roll, No? Well, what I put above is to understand how it works. What do I really do?? Well, similar to this, but instead of getting today's metrics, I ask Ftibit for the metrics of the last week! And so on, Yes, for example, yesterday, Or does 2 days that we don't have the bracelet synchronized, It's okay, 'Cause every night I lower the metrics of the last 7 days and I crush them in the BD, Like this every day, The last ones are getting off 7 and problem solved. Yes?
So I leave you here are the scripts What I'm using, In case you are interested in synchronizing only today and getting more detail from every minute… or if you are only interested in the total of each day!
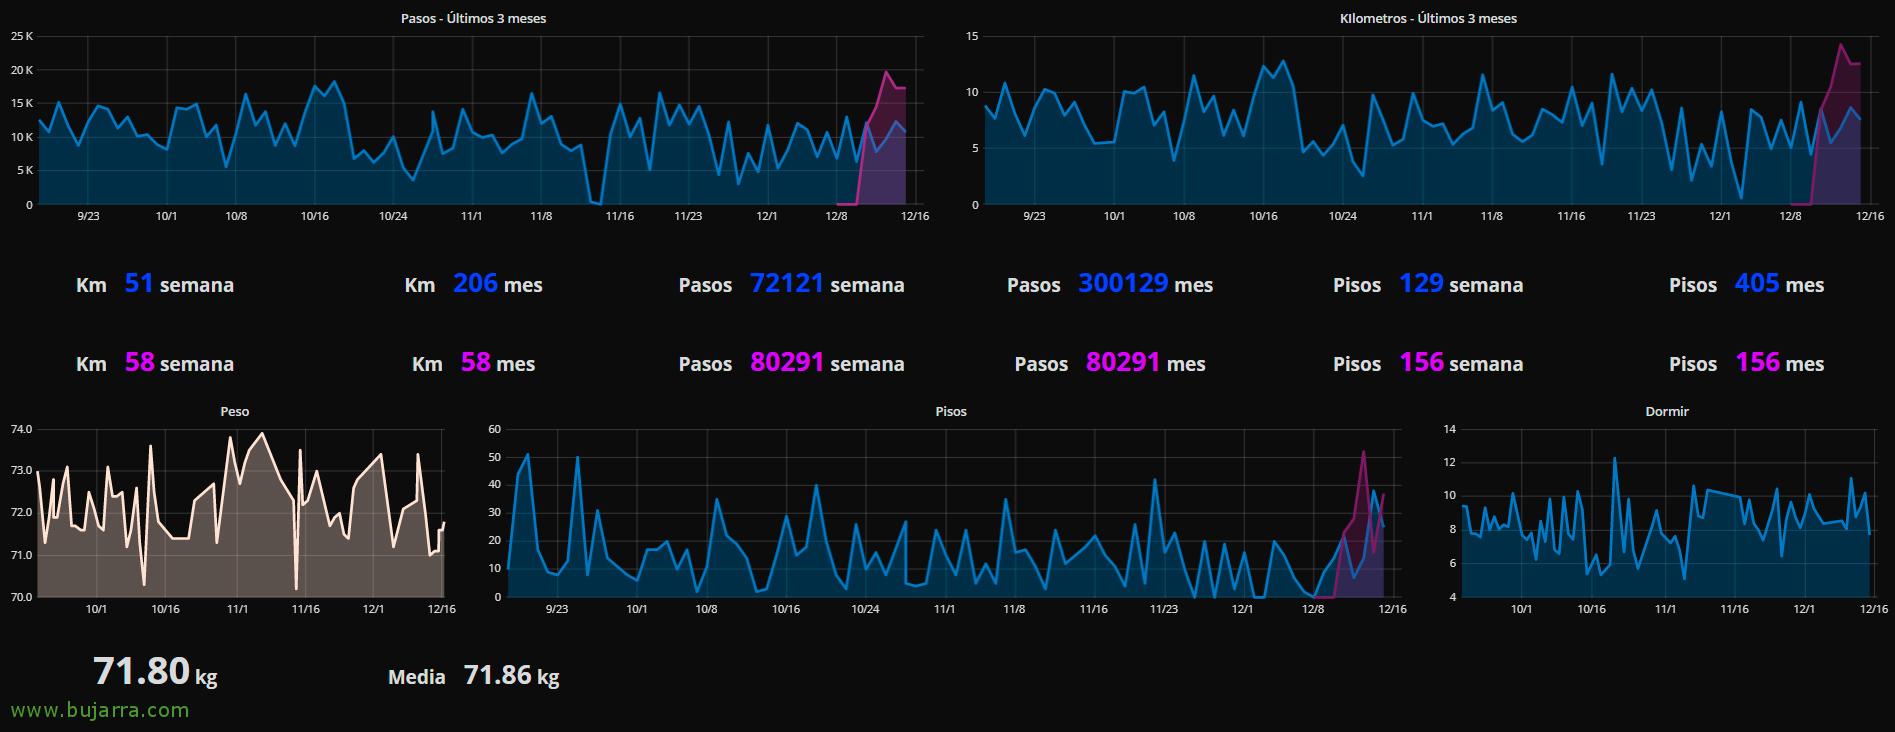
And nothing anymore, We will have to make our own Dashboards however we like them! What I said, we will use a Grafana that we already have. It is nothing more than adding MySQL as a source of origin and making the queries that interest us. We can add panels and add plugins of the type Graph to make the typical graphs… or Singlestat to display values (MySQL query results)… If you look at this screenshot, I'm showing data from 2 Bracelets, blue is me and pink is the txabala (and he has had it for a few weeks), so it's about doing what you like, Yes? The final idea of all this will be to capture it in a magic mirror that one day I will show you =)
Here are some Sample queries that I used in Grafana in case they are of any use to you:
Step Chart:
[SourceCode]SELECT pasos as value, "Pasos Hector" as metric, UNIX_TIMESTAMP(date) as time_sec FROM fitbit_pasos WHERE $__timeFilter(date) Order by Date ASC[/SourceCode]
Distance graph (km):
[SourceCode]SELECT kilometers as value, "Hector" as metric, UNIX_TIMESTAMP(date) as time_sec FROM fitbit_distancia WHERE $__timeFilter(date) Order by Date ASC[/SourceCode]
Singlestat showing the Kilometers I did this week:
[SourceCode]select sum(Km) from fitbit_distancia WHERE DATE(date) >= CURDATE() – INTERVAL 7 DAY[/SourceCode]
Using Grafana is Very very very simple, So it really, if you don't have it installed, Do it following These instructions and then try creating a Dashboard, add Panels and edit them (from its title), You will see that you have many options and all of them are very easy to understand, so that you can customize it to your liking totally! Ale, We have our body totally under control! We will store in a database all the steps we take, The kilometers we do, Our heartbeat, The hours we sleep, The floors we climb… It's time to exploit it!
We continue another day with more, You'll see what cute things we can control in our lives..